| Red | Green | Blue | |
| z | 17.64 | ||
| znorm | Inf | ||
| sky | -Inf | -NaN | -Inf |
| S/N | 15.2 | 26.8 | 29.0 |
| S/N(c) | 0.0 | 0.0 | 0.0 |
| SN(E/C) |

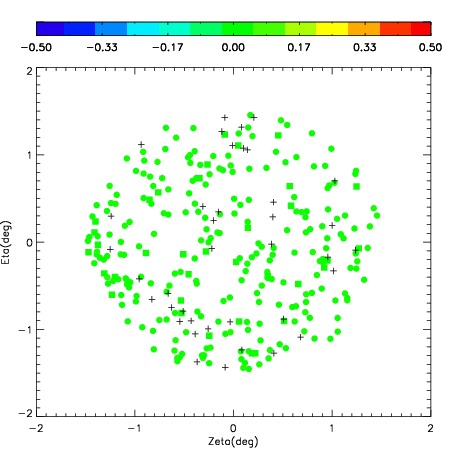

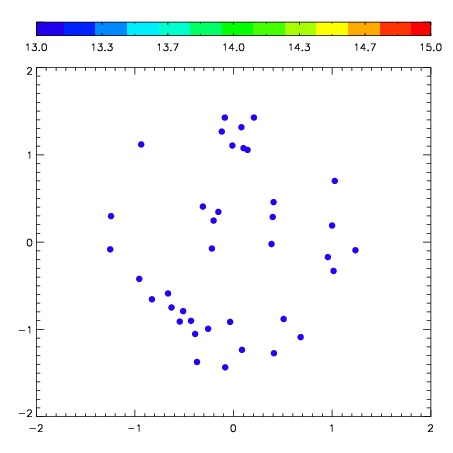
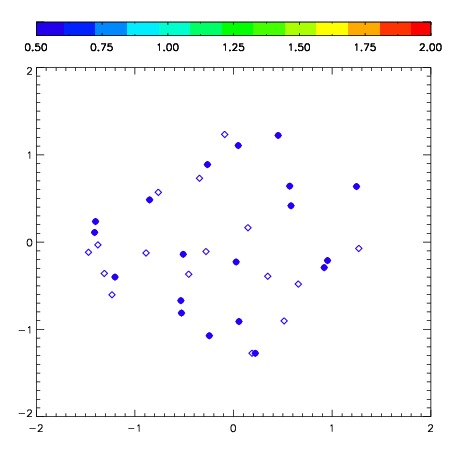
| Frame | Nreads | Zeropoints | Mag plots | Spatial mag deviation | Spatial sky 16325A emission deviations (filled: sky, open: star) | Spatial sky continuum emission | Spatial sky telluric CO2 absorption deviations (filled: H < 10) | |||||||||||||||||||||||
| 0 | 0 |
|
|
|
|
|
|
| IPAIR | NAME | SHIFT | NEWSHIFT | S/N | NAME | SHIFT | NEWSHIFT | S/N |
| 0 | 03480012 | 0.523737 | 0.00000 | 87.0861 | 03480010 | 0.00000 | 0.523737 | 91.2207 |
| 1 | 03480016 | 0.479951 | 0.0437860 | 218.604 | 03480017 | 0.0372508 | 0.486486 | 223.205 |
| 2 | 03480015 | 0.498213 | 0.0255240 | 128.560 | 03480014 | 0.0375461 | 0.486191 | 144.396 |
| 3 | 03480011 | 0.508715 | 0.0150220 | 111.539 | 03480013 | 0.0406503 | 0.483087 | 107.020 |