| Red | Green | Blue | |
| z | 17.64 | ||
| znorm | Inf | ||
| sky | -NaN | -Inf | -Inf |
| S/N | 29.8 | 51.4 | 56.6 |
| S/N(c) | 0.0 | 0.0 | 0.0 |
| SN(E/C) |

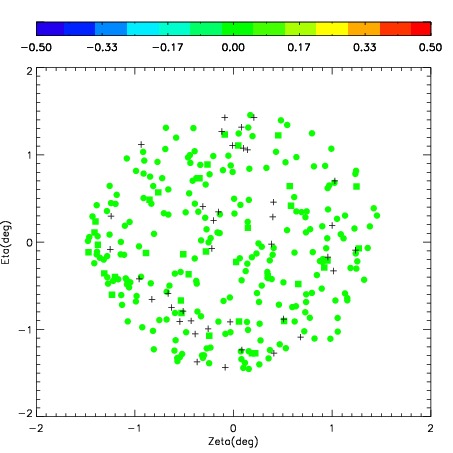

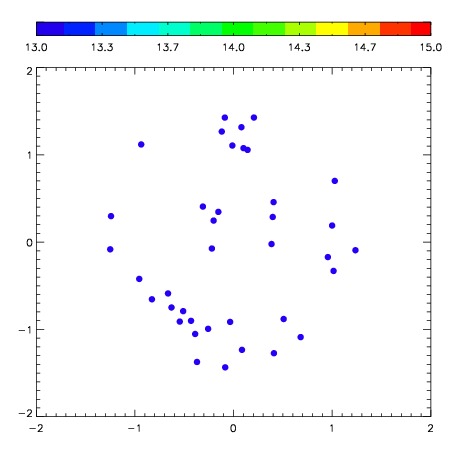
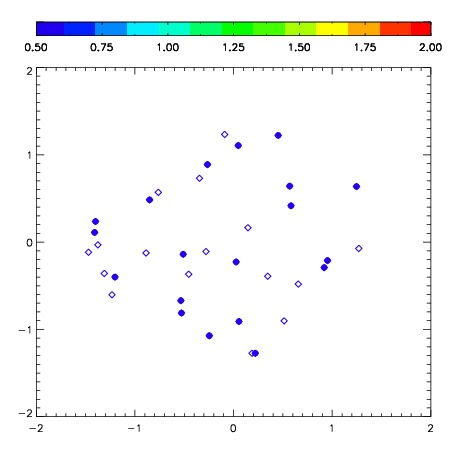
| Frame | Nreads | Zeropoints | Mag plots | Spatial mag deviation | Spatial sky 16325A emission deviations (filled: sky, open: star) | Spatial sky continuum emission | Spatial sky telluric CO2 absorption deviations (filled: H < 10) | |||||||||||||||||||||||
| 0 | 0 |
|
|
|
|
|
|
| IPAIR | NAME | SHIFT | NEWSHIFT | S/N | NAME | SHIFT | NEWSHIFT | S/N |
| 0 | 03670030 | 0.409317 | 0.00000 | 222.474 | 03670031 | 0.00618771 | 0.403129 | 224.239 |
| 1 | 03670025 | 0.409060 | 0.000256985 | 245.701 | 03670024 | 0.00000 | 0.409317 | 248.567 |
| 2 | 03670026 | 0.404199 | 0.00511798 | 241.291 | 03670027 | 0.00725749 | 0.402059 | 239.012 |
| 3 | 03670029 | 0.401174 | 0.00814298 | 226.068 | 03670028 | 0.00760216 | 0.401715 | 234.199 |
| 4 | 03670033 | 0.394791 | 0.0145260 | 221.303 | 03670032 | 0.00703996 | 0.402277 | 223.156 |