| Red | Green | Blue | |
| z | 17.64 | ||
| znorm | Inf | ||
| sky | -NaN | -NaN | -Inf |
| S/N | 31.1 | 50.5 | 60.5 |
| S/N(c) | 0.0 | 0.0 | 0.0 |
| SN(E/C) |

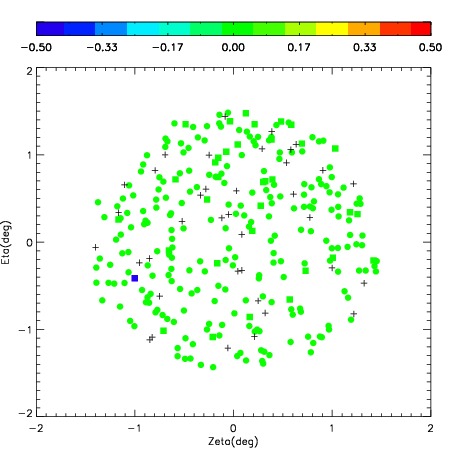

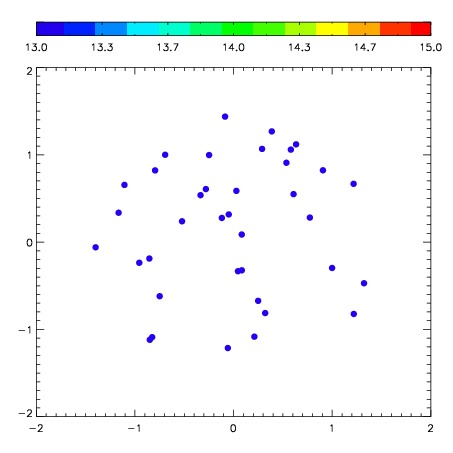
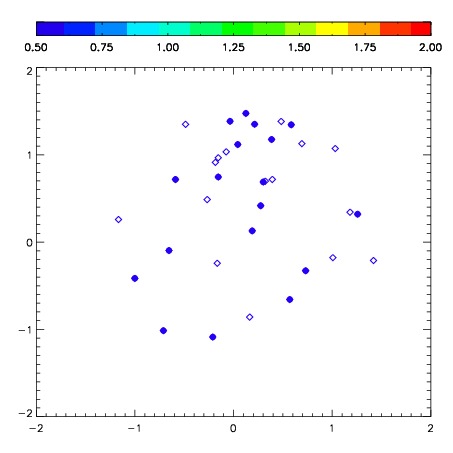
| Frame | Nreads | Zeropoints | Mag plots | Spatial mag deviation | Spatial sky 16325A emission deviations (filled: sky, open: star) | Spatial sky continuum emission | Spatial sky telluric CO2 absorption deviations (filled: H < 10) | |||||||||||||||||||||||
| 0 | 0 |
|
|
|
|
|
|
| IPAIR | NAME | SHIFT | NEWSHIFT | S/N | NAME | SHIFT | NEWSHIFT | S/N |
| 0 | 03700024 | 0.393376 | 0.00000 | 301.625 | 03700026 | -0.0185721 | 0.411948 | 300.101 |
| 1 | 03700025 | 0.392761 | 0.000615001 | 304.960 | 03700034 | -0.0193060 | 0.412682 | 302.511 |
| 2 | 03700029 | 0.388259 | 0.00511700 | 293.269 | 03700023 | 0.00000 | 0.393376 | 297.414 |
| 3 | 03700028 | 0.385836 | 0.00753999 | 293.003 | 03700027 | -0.0205929 | 0.413969 | 295.592 |
| 4 | 03700033 | 0.383376 | 0.00999999 | 289.416 | 03700031 | -0.0183272 | 0.411703 | 293.108 |
| 5 | 03700032 | 0.387479 | 0.00589699 | 286.846 | 03700030 | -0.0226749 | 0.416051 | 289.694 |