| Red | Green | Blue | |
| z | 17.64 | ||
| znorm | Inf | ||
| sky | -Inf | -NaN | -Inf |
| S/N | 21.2 | 38.2 | 42.1 |
| S/N(c) | 0.0 | 0.0 | 0.0 |
| SN(E/C) |


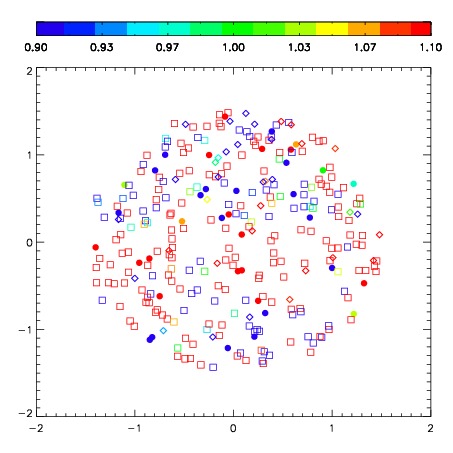
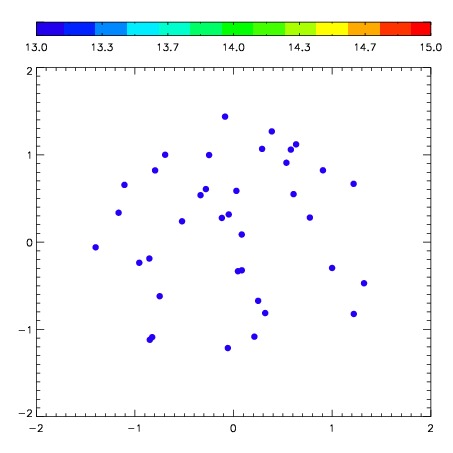
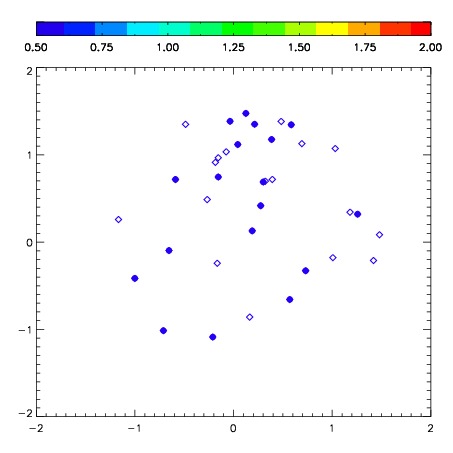
| Frame | Nreads | Zeropoints | Mag plots | Spatial mag deviation | Spatial sky 16325A emission deviations (filled: sky, open: star) | Spatial sky continuum emission | Spatial sky telluric CO2 absorption deviations (filled: H < 10) | |||||||||||||||||||||||
| 0 | 0 |
|
|
|
|
|
|
| IPAIR | NAME | SHIFT | NEWSHIFT | S/N | NAME | SHIFT | NEWSHIFT | S/N |
| 0 | 03750031 | 0.451233 | 0.00000 | 229.486 | 03750032 | -0.00180621 | 0.453039 | 239.130 |
| 1 | 03750035 | 0.445523 | 0.00571001 | 274.172 | 03750036 | -0.00572482 | 0.456958 | 284.091 |
| 2 | 03750034 | 0.444762 | 0.00647101 | 258.618 | 03750033 | -0.00466642 | 0.455899 | 250.770 |
| 3 | 03750030 | 0.447495 | 0.00373799 | 224.270 | 03750029 | 0.00000 | 0.451233 | 234.910 |