| Red | Green | Blue | |
| z | 17.64 | ||
| znorm | Inf | ||
| sky | -NaN | -Inf | -Inf |
| S/N | 19.0 | 31.5 | 36.3 |
| S/N(c) | 0.0 | 0.0 | 0.0 |
| SN(E/C) |
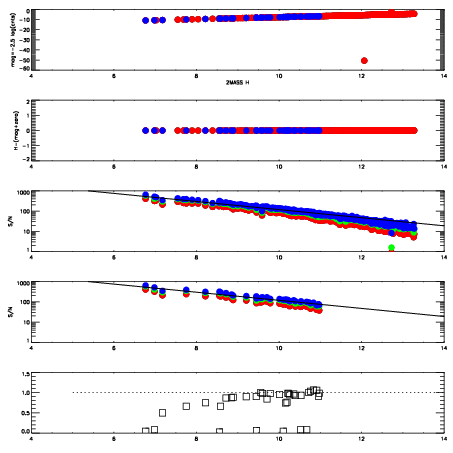


| Frame | Nreads | Zeropoints | Mag plots | Spatial mag deviation | Spatial sky 16325A emission deviations (filled: sky, open: star) | Spatial sky continuum emission | Spatial sky telluric CO2 absorption deviations (filled: H < 10) | |||||||||||||||||||||||
| 0 | 0 |
|
|
|
|
|
|
| IPAIR | NAME | SHIFT | NEWSHIFT | S/N | NAME | SHIFT | NEWSHIFT | S/N |
| 0 | 03420038 | 0.472075 | 0.00000 | 228.922 | 03420040 | 0.0469375 | 0.425137 | 229.995 |
| 1 | 03420037 | 0.466009 | 0.00606599 | 230.131 | 03420039 | 0.0499756 | 0.422099 | 238.491 |
| 2 | 03420041 | 0.467752 | 0.00432298 | 226.403 | 03420043 | 0.0455255 | 0.426549 | 228.939 |
| 3 | 03420042 | 0.459837 | 0.0122380 | 215.756 | 03420036 | 0.00000 | 0.472075 | 211.385 |