| Red | Green | Blue | |
| z | 17.64 | ||
| znorm | Inf | ||
| sky | -NaN | -NaN | -NaN |
| S/N | 23.1 | 40.1 | 44.7 |
| S/N(c) | 0.0 | 0.0 | 0.0 |
| SN(E/C) |


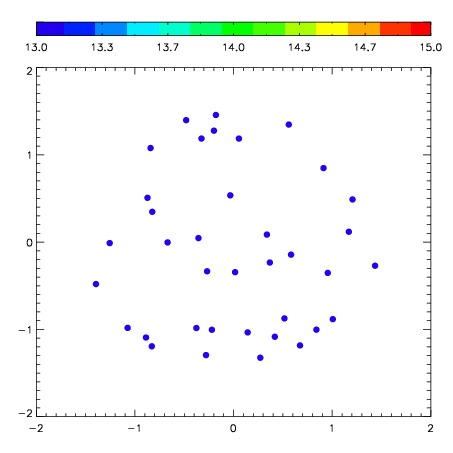

| Frame | Nreads | Zeropoints | Mag plots | Spatial mag deviation | Spatial sky 16325A emission deviations (filled: sky, open: star) | Spatial sky continuum emission | Spatial sky telluric CO2 absorption deviations (filled: H < 10) | |||||||||||||||||||||||
| 0 | 0 |
|
|
|
|
|
|
| IPAIR | NAME | SHIFT | NEWSHIFT | S/N | NAME | SHIFT | NEWSHIFT | S/N |
| 0 | 02610034 | 0.385740 | 0.00000 | 238.700 | 02610035 | 0.0235361 | 0.362204 | 203.904 |
| 1 | 02610029 | 0.357572 | 0.0281680 | 298.708 | 02610031 | 0.0156249 | 0.370115 | 311.183 |
| 2 | 02610030 | 0.363785 | 0.0219550 | 296.535 | 02610032 | 0.0137597 | 0.371980 | 297.417 |
| 3 | 02610033 | 0.363756 | 0.0219840 | 296.382 | 02610028 | 0.00000 | 0.385740 | 283.765 |