| Red | Green | Blue | |
| z | 17.64 | ||
| znorm | Inf | ||
| sky | -NaN | -NaN | -Inf |
| S/N | 27.4 | 45.9 | 51.3 |
| S/N(c) | 0.0 | 0.0 | 0.0 |
| SN(E/C) |


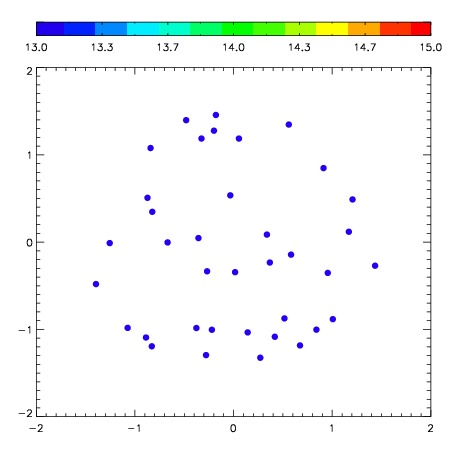
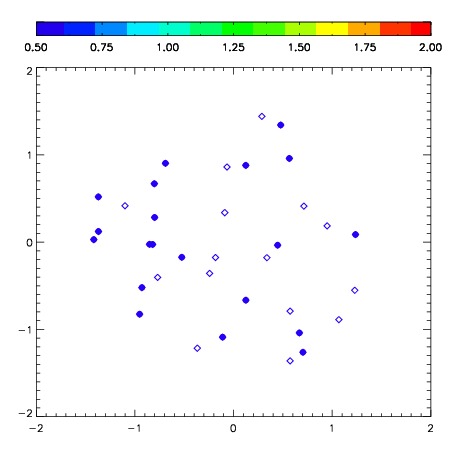
| Frame | Nreads | Zeropoints | Mag plots | Spatial mag deviation | Spatial sky 16325A emission deviations (filled: sky, open: star) | Spatial sky continuum emission | Spatial sky telluric CO2 absorption deviations (filled: H < 10) | |||||||||||||||||||||||
| 0 | 0 |
|
|
|
|
|
|
| IPAIR | NAME | SHIFT | NEWSHIFT | S/N | NAME | SHIFT | NEWSHIFT | S/N |
| 0 | 02830025 | 0.353426 | 0.00000 | 288.052 | 02830023 | 0.00228137 | 0.351145 | 287.181 |
| 1 | 02830024 | 0.347659 | 0.00576702 | 288.449 | 02830026 | 0.00337160 | 0.350054 | 287.444 |
| 2 | 02830021 | 0.343758 | 0.00966802 | 287.322 | 02830022 | 0.00432330 | 0.349103 | 285.638 |
| 3 | 02830020 | 0.340764 | 0.0126620 | 286.458 | 02830019 | 0.00000 | 0.353426 | 283.688 |