| Red | Green | Blue | |
| z | 17.64 | ||
| znorm | Inf | ||
| sky | -Inf | -Inf | -Inf |
| S/N | 22.2 | 38.4 | 51.1 |
| S/N(c) | 0.0 | 0.0 | 0.0 |
| SN(E/C) |

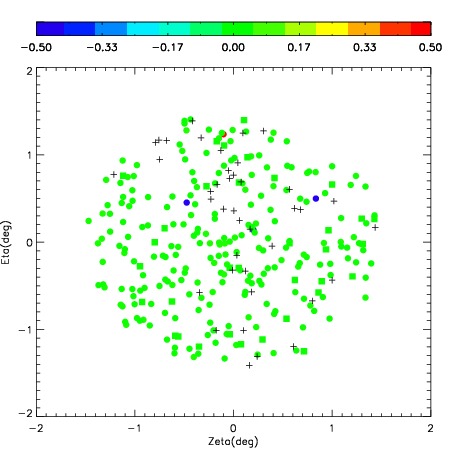
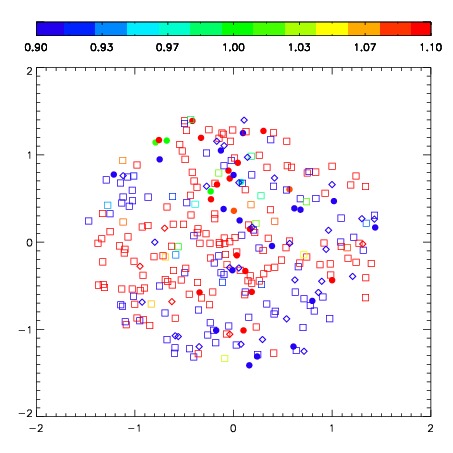

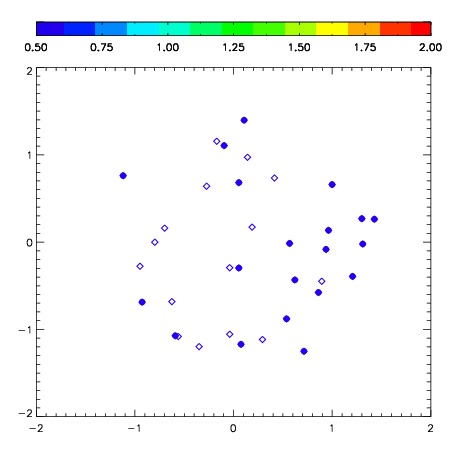
| Frame | Nreads | Zeropoints | Mag plots | Spatial mag deviation | Spatial sky 16325A emission deviations (filled: sky, open: star) | Spatial sky continuum emission | Spatial sky telluric CO2 absorption deviations (filled: H < 10) | |||||||||||||||||||||||
| 0 | 0 |
|
|
|
|
|
|
| IPAIR | NAME | SHIFT | NEWSHIFT | S/N | NAME | SHIFT | NEWSHIFT | S/N |
| 0 | 02610055 | 0.482300 | 0.00000 | 244.039 | 02610054 | 0.0646321 | 0.417668 | 232.732 |
| 1 | 02610056 | 0.475579 | 0.00672102 | 242.436 | 02610053 | 0.0650753 | 0.417225 | 230.101 |
| 2 | 02610051 | 0.475494 | 0.00680602 | 232.844 | 02610050 | 0.00000 | 0.482300 | 222.028 |
| 3 | 02610052 | 0.473583 | 0.00871700 | 224.279 | 02610057 | 0.0594156 | 0.422884 | 212.683 |