| Red | Green | Blue | |
| z | 17.64 | ||
| znorm | Inf | ||
| sky | -Inf | -Inf | -Inf |
| S/N | 10.2 | 21.3 | 21.9 |
| S/N(c) | 0.0 | 0.0 | 0.0 |
| SN(E/C) |

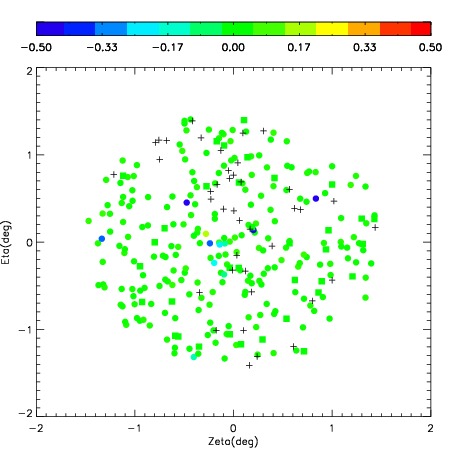

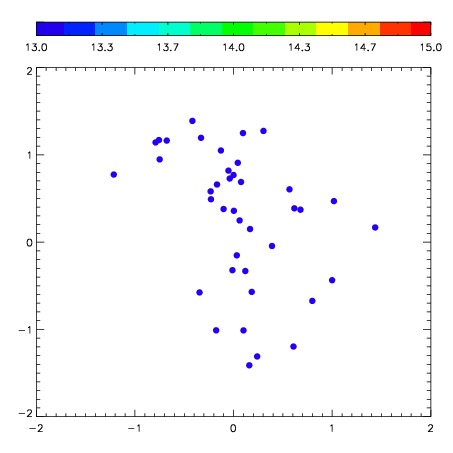
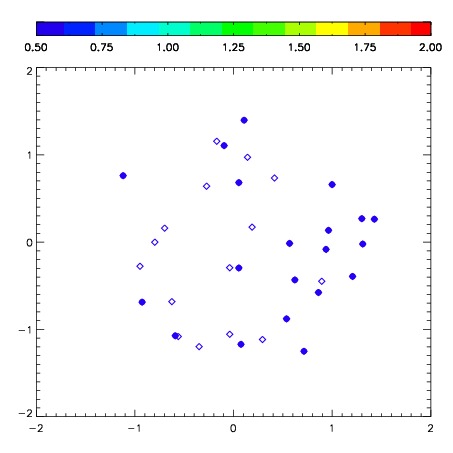
| Frame | Nreads | Zeropoints | Mag plots | Spatial mag deviation | Spatial sky 16325A emission deviations (filled: sky, open: star) | Spatial sky continuum emission | Spatial sky telluric CO2 absorption deviations (filled: H < 10) | |||||||||||||||||||||||
| 0 | 0 |
|
|
|
|
|
|
| IPAIR | NAME | SHIFT | NEWSHIFT | S/N | NAME | SHIFT | NEWSHIFT | S/N |
| 0 | 03440036 | 0.529386 | 0.00000 | 112.392 | 03440037 | 0.0505166 | 0.478869 | 104.096 |
| 1 | 03440032 | 0.525251 | 0.00413501 | 150.775 | 03440030 | 0.00000 | 0.529386 | 155.162 |
| 2 | 03440031 | 0.525932 | 0.00345397 | 144.247 | 03440033 | 0.0488853 | 0.480501 | 135.231 |
| 3 | 03440035 | 0.528242 | 0.00114399 | 119.864 | 03440034 | 0.0479595 | 0.481426 | 134.537 |