| Red | Green | Blue | |
| z | 17.64 | ||
| znorm | Inf | ||
| sky | -Inf | -NaN | -Inf |
| S/N | 27.1 | 45.7 | 48.4 |
| S/N(c) | 0.0 | 0.0 | 0.0 |
| SN(E/C) |

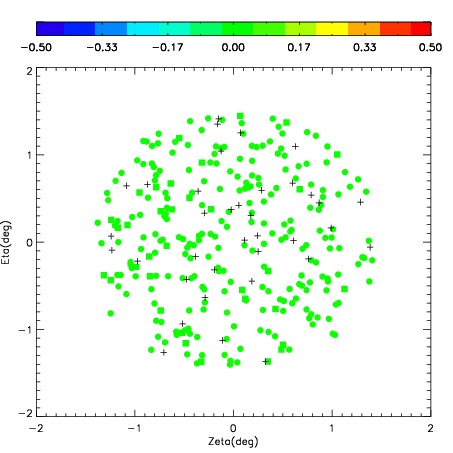

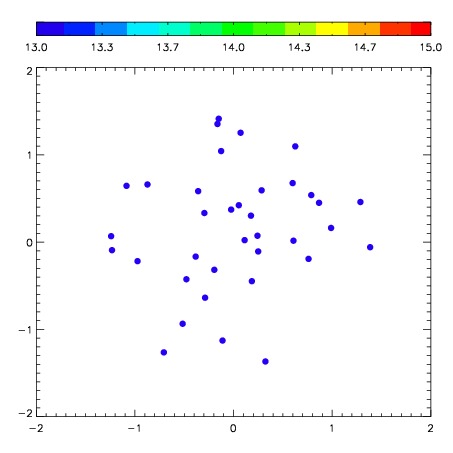
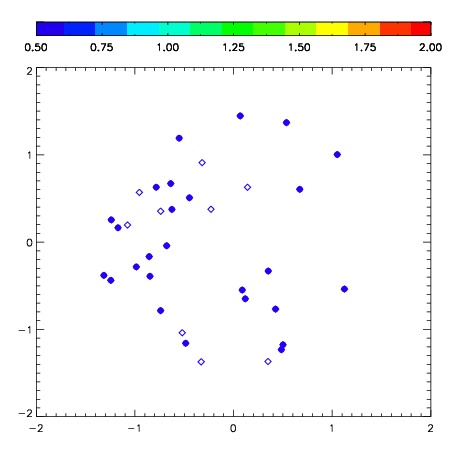
| Frame | Nreads | Zeropoints | Mag plots | Spatial mag deviation | Spatial sky 16325A emission deviations (filled: sky, open: star) | Spatial sky continuum emission | Spatial sky telluric CO2 absorption deviations (filled: H < 10) | |||||||||||||||||||||||
| 0 | 0 |
|
|
|
|
|
|
| IPAIR | NAME | SHIFT | NEWSHIFT | S/N | NAME | SHIFT | NEWSHIFT | S/N |
| 0 | 03680021 | 0.412949 | 0.00000 | 274.277 | 03680022 | -0.0375360 | 0.450485 | 279.868 |
| 1 | 03680020 | 0.400594 | 0.0123550 | 285.617 | 03680019 | 0.00000 | 0.412949 | 286.096 |
| 2 | 03680025 | 0.404160 | 0.00878900 | 278.217 | 03680023 | -0.0394408 | 0.452390 | 280.430 |
| 3 | 03680024 | 0.406622 | 0.00632700 | 268.830 | 03680026 | -0.0404315 | 0.453380 | 278.224 |