| Red | Green | Blue | |
| z | 17.64 | ||
| znorm | Inf | ||
| sky | -Inf | -Inf | -Inf |
| S/N | 12.2 | 24.5 | 26.4 |
| S/N(c) | 0.0 | 0.0 | 0.0 |
| SN(E/C) |

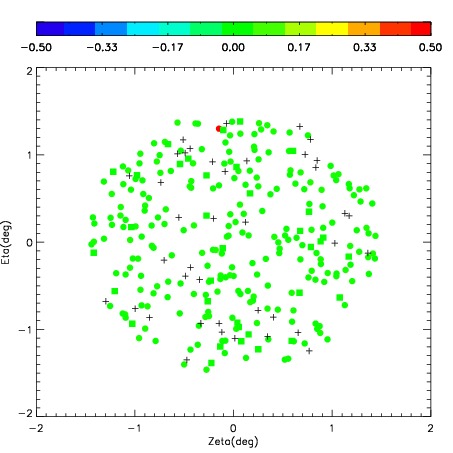

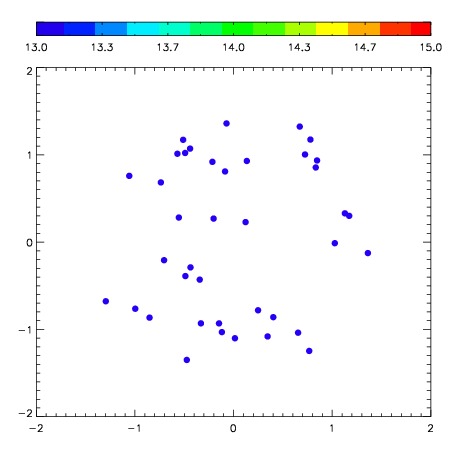
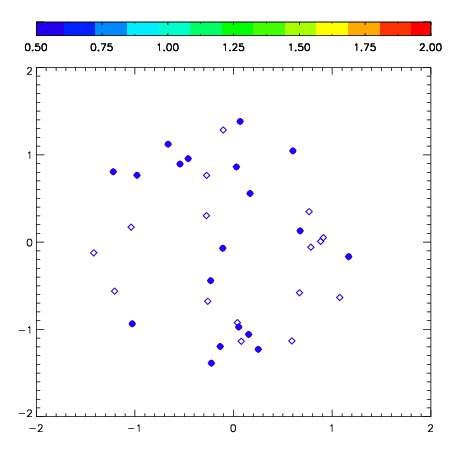
| Frame | Nreads | Zeropoints | Mag plots | Spatial mag deviation | Spatial sky 16325A emission deviations (filled: sky, open: star) | Spatial sky continuum emission | Spatial sky telluric CO2 absorption deviations (filled: H < 10) | |||||||||||||||||||||||
| 0 | 0 |
|
|
|
|
|
|
| IPAIR | NAME | SHIFT | NEWSHIFT | S/N | NAME | SHIFT | NEWSHIFT | S/N |
| 0 | 03100070 | 0.453566 | 0.00000 | 93.2089 | 03100068 | -0.0172538 | 0.470820 | 99.6782 |
| 1 | 03100066 | 0.440785 | 0.0127810 | 219.964 | 03100069 | -0.0176704 | 0.471236 | 172.901 |
| 2 | 03100071 | 0.447456 | 0.00611001 | 173.724 | 03100065 | 0.00000 | 0.453566 | 171.621 |
| 3 | 03100067 | 0.448956 | 0.00461000 | 118.126 | 03100072 | -0.0188044 | 0.472370 | 161.135 |