| Red | Green | Blue | |
| z | 17.64 | ||
| znorm | Inf | ||
| sky | -Inf | -Inf | -Inf |
| S/N | 26.2 | 46.9 | 51.4 |
| S/N(c) | 0.0 | 0.0 | 0.0 |
| SN(E/C) |

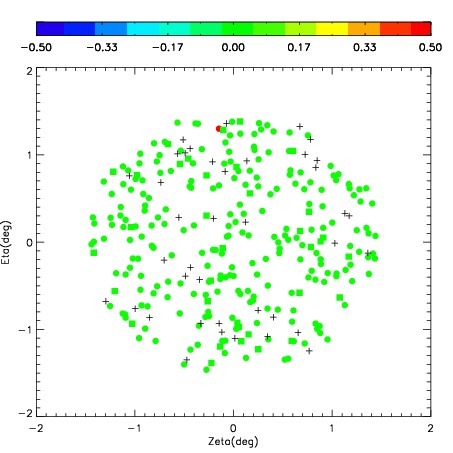
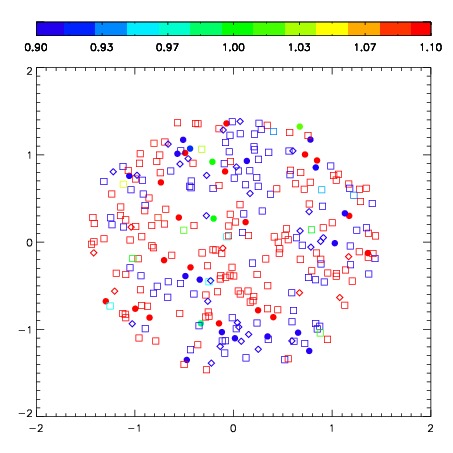


| Frame | Nreads | Zeropoints | Mag plots | Spatial mag deviation | Spatial sky 16325A emission deviations (filled: sky, open: star) | Spatial sky continuum emission | Spatial sky telluric CO2 absorption deviations (filled: H < 10) | |||||||||||||||||||||||
| 0 | 0 |
|
|
|
|
|
|
| IPAIR | NAME | SHIFT | NEWSHIFT | S/N | NAME | SHIFT | NEWSHIFT | S/N |
| 0 | 03120067 | 0.425444 | 0.00000 | 258.508 | 03120062 | 0.00000 | 0.425444 | 260.907 |
| 1 | 03120064 | 0.414883 | 0.0105610 | 269.977 | 03120065 | -0.00611328 | 0.431557 | 271.767 |
| 2 | 03120063 | 0.418663 | 0.00678101 | 263.491 | 03120066 | -0.0103799 | 0.435824 | 270.106 |
| 3 | 03120068 | 0.417005 | 0.00843900 | 260.527 | 03120069 | -0.00706676 | 0.432511 | 264.717 |