| Red | Green | Blue | |
| z | 17.64 | ||
| znorm | Inf | ||
| sky | -Inf | -Inf | -Inf |
| S/N | 24.8 | 40.3 | 43.4 |
| S/N(c) | 0.0 | 0.0 | 0.0 |
| SN(E/C) |


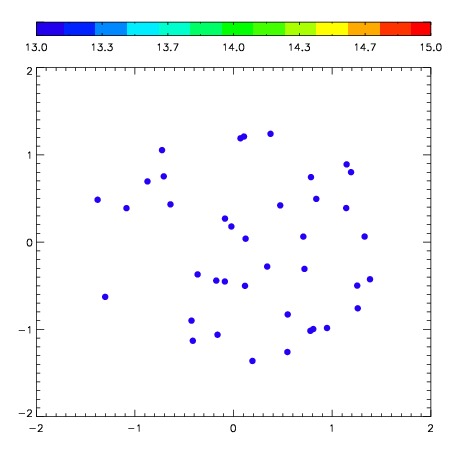
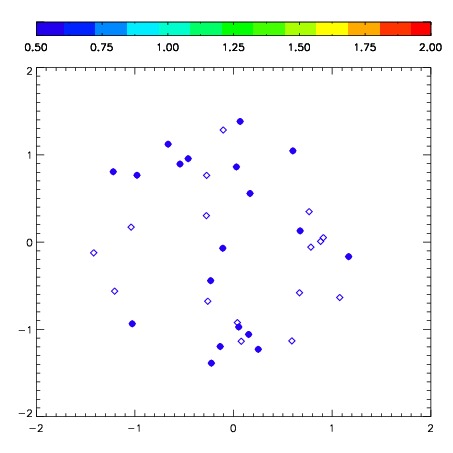
| Frame | Nreads | Zeropoints | Mag plots | Spatial mag deviation | Spatial sky 16325A emission deviations (filled: sky, open: star) | Spatial sky continuum emission | Spatial sky telluric CO2 absorption deviations (filled: H < 10) | |||||||||||||||||||||||
| 0 | 0 |
|
|
|
|
|
|
| IPAIR | NAME | SHIFT | NEWSHIFT | S/N | NAME | SHIFT | NEWSHIFT | S/N |
| 0 | 02930029 | 0.242214 | 0.00000 | 287.698 | 02930026 | -0.0547245 | 0.296938 | 285.833 |
| 1 | 02930028 | 0.235561 | 0.00665300 | 287.652 | 02930023 | 0.00000 | 0.242214 | 274.481 |
| 2 | 02930025 | 0.231018 | 0.0111960 | 282.074 | 02930027 | -0.0571949 | 0.299409 | 244.213 |
| 3 | 02930024 | 0.226150 | 0.0160640 | 258.726 | 02930030 | -0.0569125 | 0.299127 | 0.00000 |