| Red | Green | Blue | |
| z | 17.64 | ||
| znorm | Inf | ||
| sky | -NaN | -NaN | -Inf |
| S/N | 27.4 | 46.8 | 50.5 |
| S/N(c) | 0.0 | 0.0 | 0.0 |
| SN(E/C) |

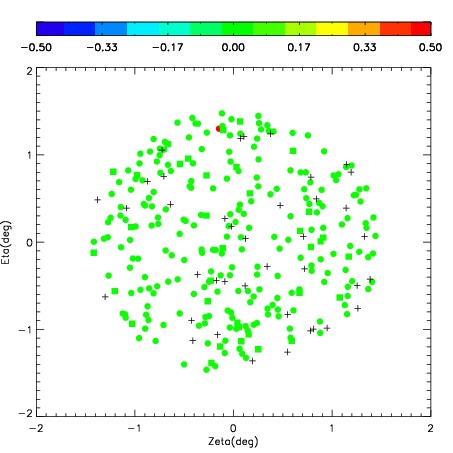
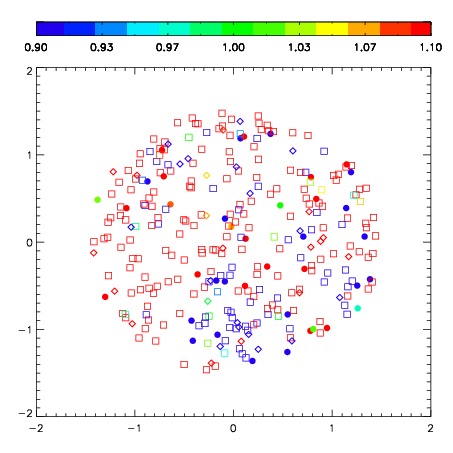


| Frame | Nreads | Zeropoints | Mag plots | Spatial mag deviation | Spatial sky 16325A emission deviations (filled: sky, open: star) | Spatial sky continuum emission | Spatial sky telluric CO2 absorption deviations (filled: H < 10) | |||||||||||||||||||||||
| 0 | 0 |
|
|
|
|
|
|
| IPAIR | NAME | SHIFT | NEWSHIFT | S/N | NAME | SHIFT | NEWSHIFT | S/N |
| 0 | 03690036 | 0.441167 | 0.00000 | 268.608 | 03690041 | -0.0233453 | 0.464512 | 270.697 |
| 1 | 03690039 | 0.427186 | 0.0139810 | 274.608 | 03690038 | -0.0238332 | 0.465000 | 279.962 |
| 2 | 03690040 | 0.417152 | 0.0240150 | 267.208 | 03690037 | -0.0210326 | 0.462200 | 268.811 |
| 3 | 03690035 | 0.436076 | 0.00509101 | 263.824 | 03690034 | 0.00000 | 0.441167 | 254.802 |