| Red | Green | Blue | |
| z | 17.64 | ||
| znorm | Inf | ||
| sky | -NaN | -Inf | -Inf |
| S/N | 29.6 | 46.4 | 53.7 |
| S/N(c) | 0.0 | 0.0 | 0.0 |
| SN(E/C) |
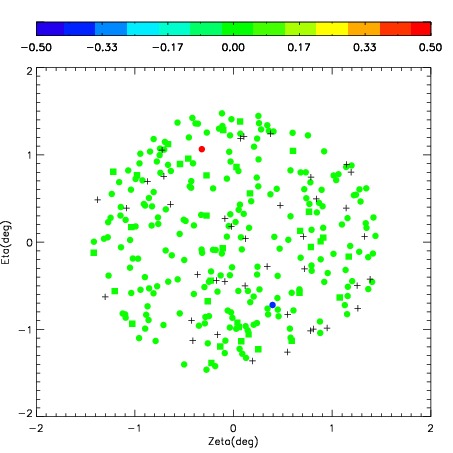
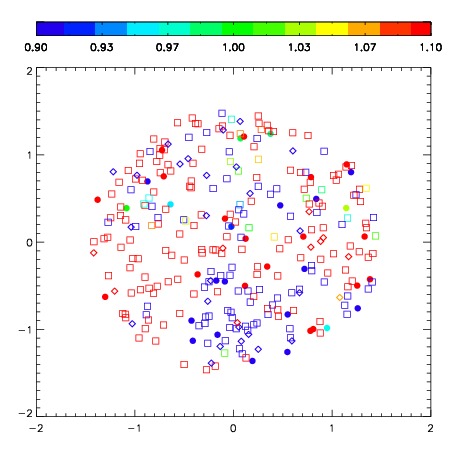
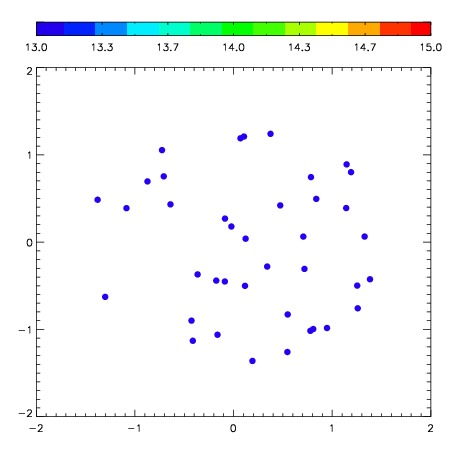
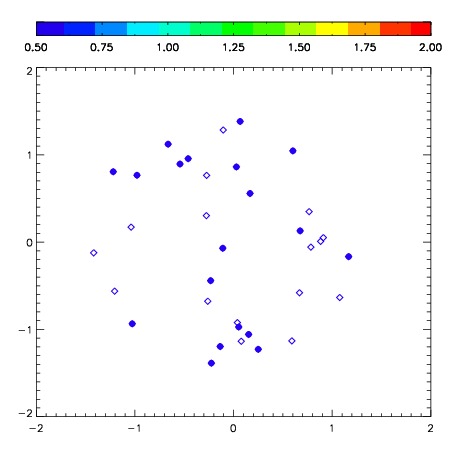
| Frame | Nreads | Zeropoints | Mag plots | Spatial mag deviation | Spatial sky 16325A emission deviations (filled: sky, open: star) | Spatial sky continuum emission | Spatial sky telluric CO2 absorption deviations (filled: H < 10) | |||||||||||||||||||||||
| 0 | 0 |
|
|
|
|
|
|
| IPAIR | NAME | SHIFT | NEWSHIFT | S/N | NAME | SHIFT | NEWSHIFT | S/N |
| 0 | 03940027 | 0.412260 | 0.00000 | 256.646 | 03940028 | 0.00164884 | 0.410611 | 259.836 |
| 1 | 03940031 | 0.402999 | 0.00926098 | 268.061 | 03940032 | -0.00241066 | 0.414671 | 274.974 |
| 2 | 03940030 | 0.409628 | 0.00263199 | 265.251 | 03940025 | 0.00000 | 0.412260 | 269.961 |
| 3 | 03940026 | 0.410725 | 0.00153500 | 265.213 | 03940029 | 0.00631339 | 0.405947 | 264.856 |