| Red | Green | Blue | |
| z | 17.64 | ||
| znorm | Inf | ||
| sky | -NaN | -Inf | -Inf |
| S/N | 29.4 | 48.4 | 53.9 |
| S/N(c) | 0.0 | 0.0 | 0.0 |
| SN(E/C) |


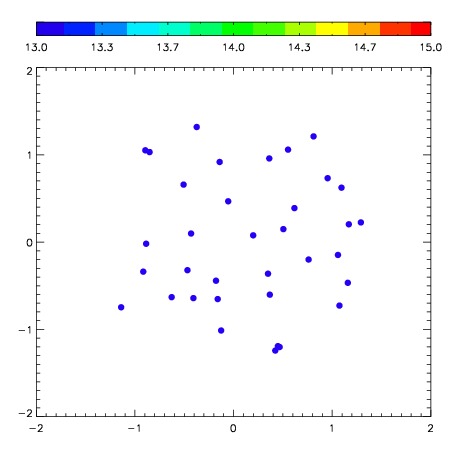
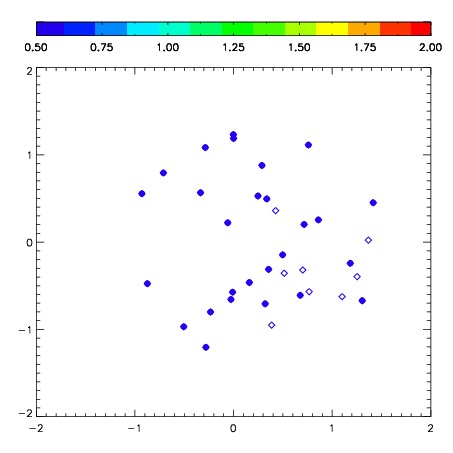
| Frame | Nreads | Zeropoints | Mag plots | Spatial mag deviation | Spatial sky 16325A emission deviations (filled: sky, open: star) | Spatial sky continuum emission | Spatial sky telluric CO2 absorption deviations (filled: H < 10) | |||||||||||||||||||||||
| 0 | 0 |
|
|
|
|
|
|
| IPAIR | NAME | SHIFT | NEWSHIFT | S/N | NAME | SHIFT | NEWSHIFT | S/N |
| 0 | 03200049 | 0.474026 | 0.00000 | 266.217 | 03200050 | 0.0228233 | 0.451203 | 273.647 |
| 1 | 03200052 | 0.468282 | 0.00574398 | 277.609 | 03200054 | 0.0290986 | 0.444927 | 278.784 |
| 2 | 03200053 | 0.470969 | 0.00305700 | 276.220 | 03200051 | 0.0236190 | 0.450407 | 275.527 |
| 3 | 03200048 | 0.463297 | 0.0107290 | 260.637 | 03200047 | 0.00000 | 0.474026 | 258.004 |