| Red | Green | Blue | |
| z | 17.64 | ||
| znorm | Inf | ||
| sky | -NaN | -NaN | -Inf |
| S/N | 30.1 | 50.8 | 52.8 |
| S/N(c) | 0.0 | 0.0 | 0.0 |
| SN(E/C) |

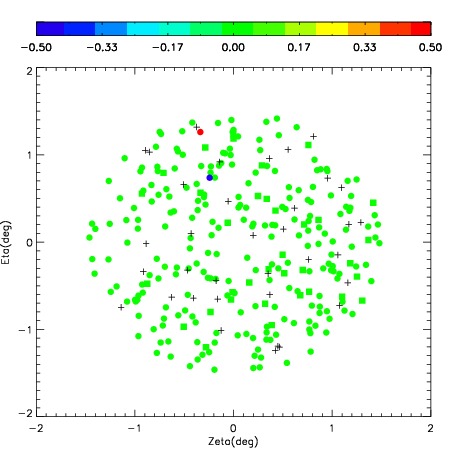
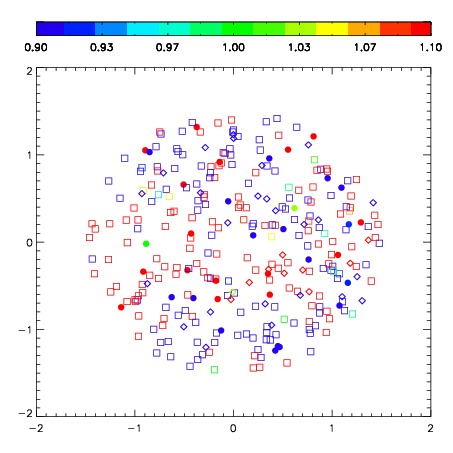
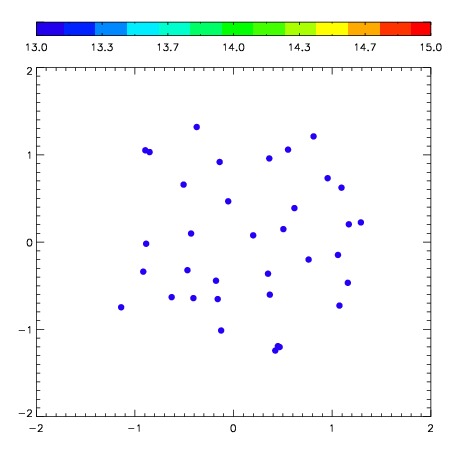
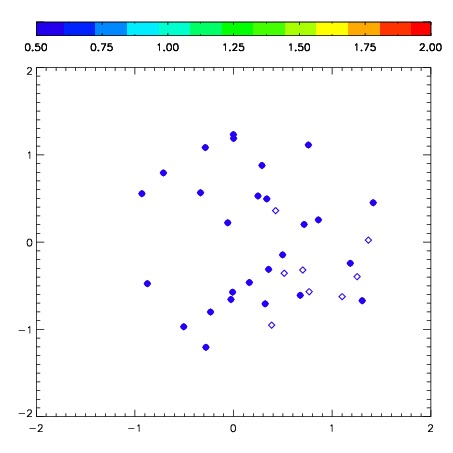
| Frame | Nreads | Zeropoints | Mag plots | Spatial mag deviation | Spatial sky 16325A emission deviations (filled: sky, open: star) | Spatial sky continuum emission | Spatial sky telluric CO2 absorption deviations (filled: H < 10) | |||||||||||||||||||||||
| 0 | 0 |
|
|
|
|
|
|
| IPAIR | NAME | SHIFT | NEWSHIFT | S/N | NAME | SHIFT | NEWSHIFT | S/N |
| 0 | 03670038 | 0.467959 | 0.00000 | 269.954 | 03670037 | 0.00000 | 0.467959 | 268.270 |
| 1 | 03670043 | 0.459065 | 0.00889400 | 276.208 | 03670041 | 0.0300013 | 0.437958 | 277.743 |
| 2 | 03670042 | 0.450742 | 0.0172170 | 275.543 | 03670044 | 0.0278876 | 0.440071 | 277.582 |
| 3 | 03670039 | 0.462498 | 0.00546098 | 275.134 | 03670040 | 0.0311934 | 0.436766 | 274.295 |