| Red | Green | Blue | |
| z | 17.64 | ||
| znorm | Inf | ||
| sky | -Inf | -Inf | -Inf |
| S/N | 16.8 | 31.1 | 32.3 |
| S/N(c) | 0.0 | 0.0 | 0.0 |
| SN(E/C) |


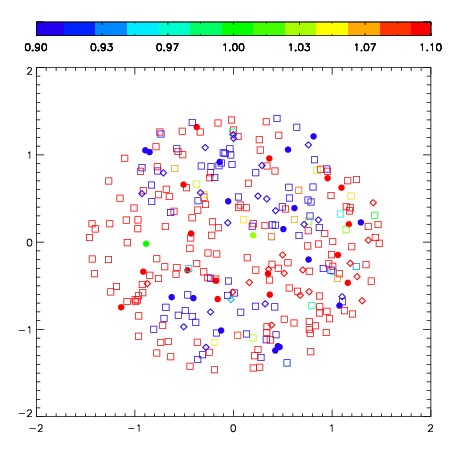
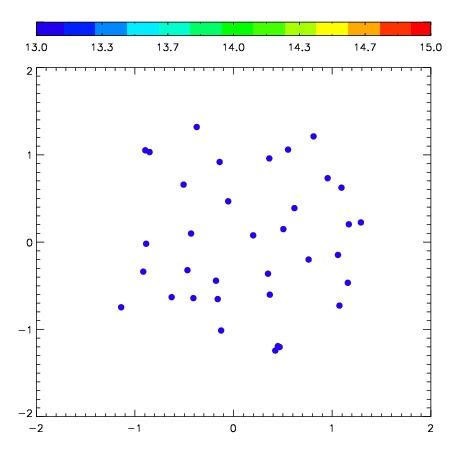
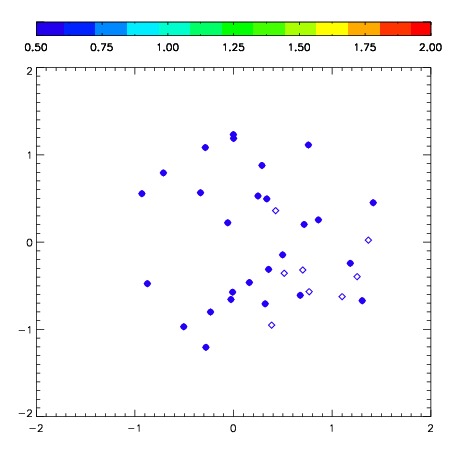
| Frame | Nreads | Zeropoints | Mag plots | Spatial mag deviation | Spatial sky 16325A emission deviations (filled: sky, open: star) | Spatial sky continuum emission | Spatial sky telluric CO2 absorption deviations (filled: H < 10) | |||||||||||||||||||||||
| 0 | 0 |
|
|
|
|
|
|
| IPAIR | NAME | SHIFT | NEWSHIFT | S/N | NAME | SHIFT | NEWSHIFT | S/N |
| 0 | 03770012 | 0.533384 | 0.00000 | 189.920 | 03770013 | 0.0591419 | 0.474242 | 234.788 |
| 1 | 03770011 | 0.530000 | 0.00338405 | 177.416 | 03770014 | 0.0552842 | 0.478100 | 228.179 |
| 2 | 03770016 | 0.533340 | 4.40478e-05 | 176.472 | 03770017 | 0.0524147 | 0.480969 | 220.206 |
| 3 | 03770015 | 0.529138 | 0.00424600 | 150.990 | 03770010 | 0.00000 | 0.533384 | 164.878 |