| Red | Green | Blue | |
| z | 17.64 | ||
| znorm | Inf | ||
| sky | -Inf | -Inf | -Inf |
| S/N | 22.2 | 36.0 | 38.1 |
| S/N(c) | 0.0 | 0.0 | 0.0 |
| SN(E/C) |

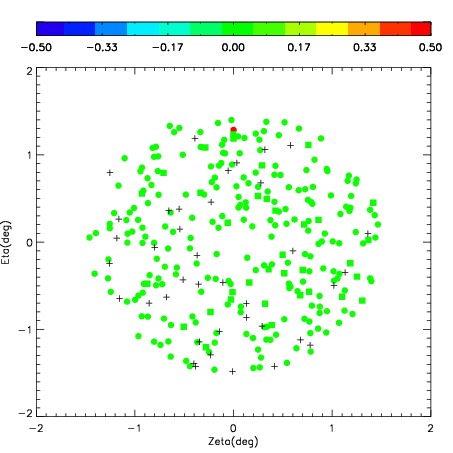
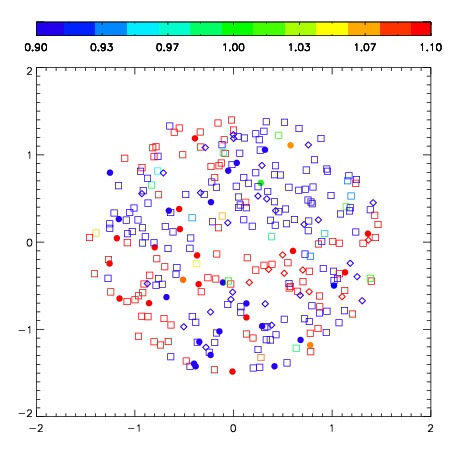

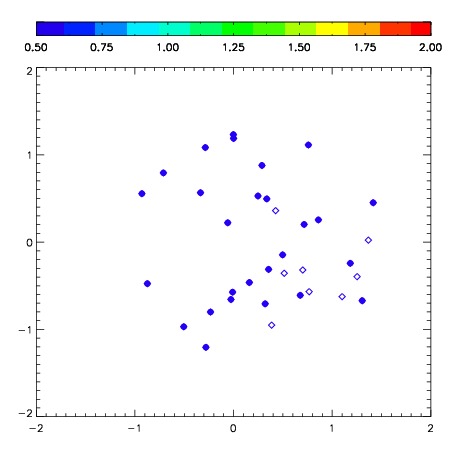
| Frame | Nreads | Zeropoints | Mag plots | Spatial mag deviation | Spatial sky 16325A emission deviations (filled: sky, open: star) | Spatial sky continuum emission | Spatial sky telluric CO2 absorption deviations (filled: H < 10) | |||||||||||||||||||||||
| 0 | 0 |
|
|
|
|
|
|
| IPAIR | NAME | SHIFT | NEWSHIFT | S/N | NAME | SHIFT | NEWSHIFT | S/N |
| 0 | 04030014 | 0.517668 | 0.00000 | 63.4655 | 04030012 | 0.00000 | 0.517668 | 169.567 |
| 1 | 04030017 | 0.460712 | 0.0569560 | 255.313 | 04030019 | 0.0338144 | 0.483854 | 248.745 |
| 2 | 04030018 | 0.476306 | 0.0413620 | 216.965 | 04030015 | 0.0382049 | 0.479463 | 248.231 |
| 3 | 04030013 | 0.498822 | 0.0188460 | 170.396 | 04030016 | 0.0362459 | 0.481422 | 244.858 |