| Red | Green | Blue | |
| z | 17.64 | ||
| znorm | Inf | ||
| sky | -Inf | -Inf | -Inf |
| S/N | 27.3 | 44.4 | 49.1 |
| S/N(c) | 0.0 | 0.0 | 0.0 |
| SN(E/C) |

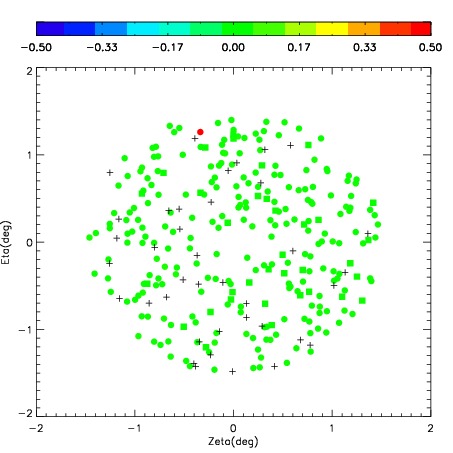
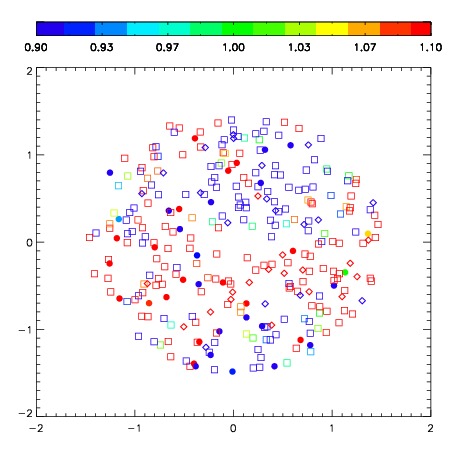

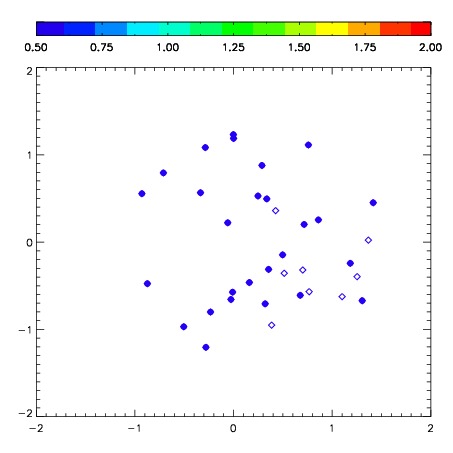
| Frame | Nreads | Zeropoints | Mag plots | Spatial mag deviation | Spatial sky 16325A emission deviations (filled: sky, open: star) | Spatial sky continuum emission | Spatial sky telluric CO2 absorption deviations (filled: H < 10) | |||||||||||||||||||||||
| 0 | 0 |
|
|
|
|
|
|
| IPAIR | NAME | SHIFT | NEWSHIFT | S/N | NAME | SHIFT | NEWSHIFT | S/N |
| 0 | 06700076 | 0.458443 | 0.00000 | 268.848 | 06700078 | 0.0316915 | 0.426751 | 273.093 |
| 1 | 06700079 | 0.455706 | 0.00273699 | 279.036 | 06700074 | 0.00000 | 0.458443 | 274.633 |
| 2 | 06700080 | 0.457944 | 0.000498980 | 277.708 | 06700081 | 0.0319981 | 0.426445 | 273.207 |
| 3 | 06700075 | 0.456609 | 0.00183398 | 270.672 | 06700077 | 0.0276648 | 0.430778 | 273.152 |