| Red | Green | Blue | |
| z | 17.64 | ||
| znorm | Inf | ||
| sky | -NaN | -Inf | -Inf |
| S/N | 20.1 | 36.9 | 39.1 |
| S/N(c) | 0.0 | 0.0 | 0.0 |
| SN(E/C) |

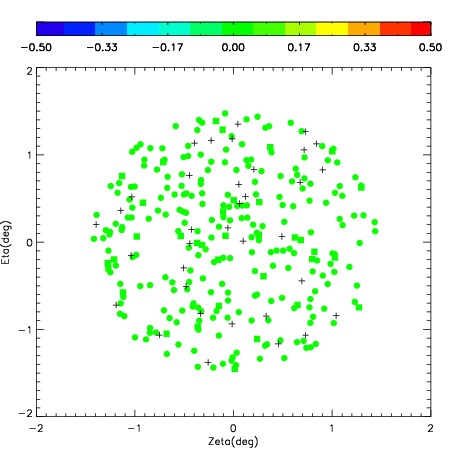

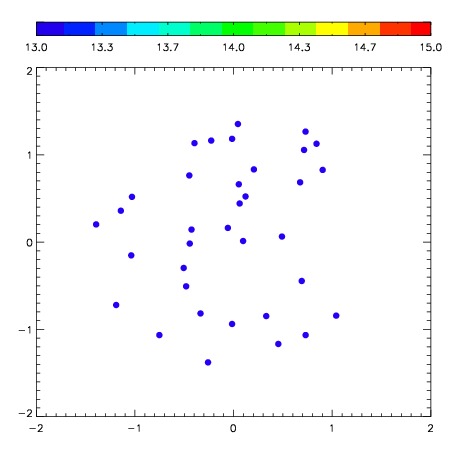
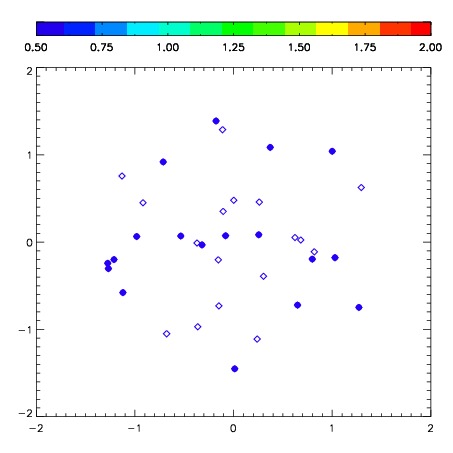
| Frame | Nreads | Zeropoints | Mag plots | Spatial mag deviation | Spatial sky 16325A emission deviations (filled: sky, open: star) | Spatial sky continuum emission | Spatial sky telluric CO2 absorption deviations (filled: H < 10) | |||||||||||||||||||||||
| 0 | 0 |
|
|
|
|
|
|
| IPAIR | NAME | SHIFT | NEWSHIFT | S/N | NAME | SHIFT | NEWSHIFT | S/N |
| 0 | 04050016 | 0.434437 | 0.00000 | 191.270 | 04050010 | 0.00000 | 0.434437 | 205.581 |
| 1 | 04050012 | 0.421020 | 0.0134170 | 220.008 | 04050013 | -0.0290381 | 0.463475 | 219.260 |
| 2 | 04050011 | 0.417573 | 0.0168640 | 206.603 | 04050017 | -0.0277897 | 0.462227 | 206.310 |
| 3 | 04050015 | 0.425836 | 0.00860101 | 200.810 | 04050014 | -0.0324076 | 0.466845 | 206.275 |