| Red | Green | Blue | |
| z | 17.64 | ||
| znorm | Inf | ||
| sky | -NaN | -NaN | -Inf |
| S/N | 32.7 | 55.4 | 60.0 |
| S/N(c) | 0.0 | 0.0 | 0.0 |
| SN(E/C) |

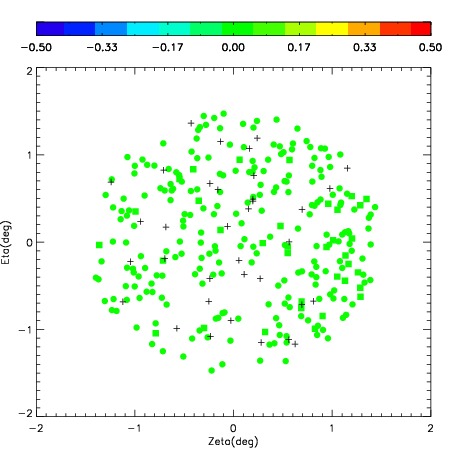
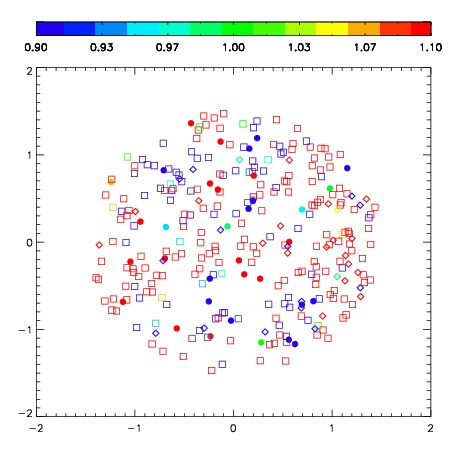


| Frame | Nreads | Zeropoints | Mag plots | Spatial mag deviation | Spatial sky 16325A emission deviations (filled: sky, open: star) | Spatial sky continuum emission | Spatial sky telluric CO2 absorption deviations (filled: H < 10) | |||||||||||||||||||||||
| 0 | 0 |
|
|
|
|
|
|
| IPAIR | NAME | SHIFT | NEWSHIFT | S/N | NAME | SHIFT | NEWSHIFT | S/N |
| 0 | 03410076 | 0.431503 | 0.00000 | 229.437 | 03410077 | -0.0140650 | 0.445568 | 228.931 |
| 1 | 03410071 | 0.421303 | 0.0102000 | 241.766 | 03410073 | -0.0106338 | 0.442137 | 245.906 |
| 2 | 03410072 | 0.423148 | 0.00835499 | 240.491 | 03410074 | -0.0127427 | 0.444246 | 243.750 |
| 3 | 03410075 | 0.428252 | 0.00325099 | 230.771 | 03410070 | 0.00000 | 0.431503 | 237.803 |