| Red | Green | Blue | |
| z | 17.64 | ||
| znorm | Inf | ||
| sky | -NaN | -Inf | -Inf |
| S/N | 27.2 | 45.9 | 49.2 |
| S/N(c) | 0.0 | 0.0 | 0.0 |
| SN(E/C) |

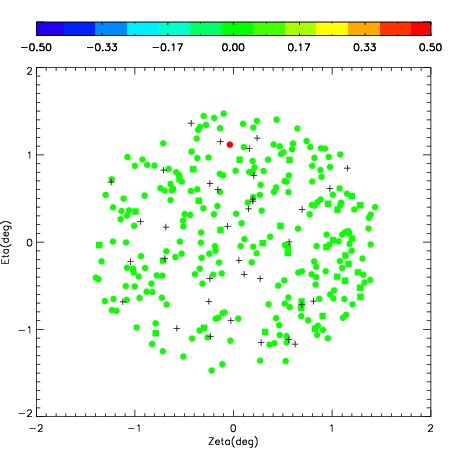
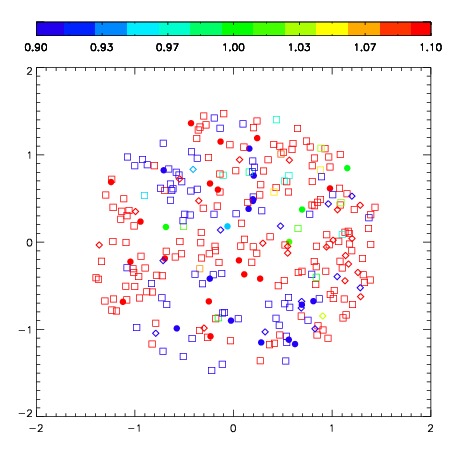


| Frame | Nreads | Zeropoints | Mag plots | Spatial mag deviation | Spatial sky 16325A emission deviations (filled: sky, open: star) | Spatial sky continuum emission | Spatial sky telluric CO2 absorption deviations (filled: H < 10) | |||||||||||||||||||||||
| 0 | 0 |
|
|
|
|
|
|
| IPAIR | NAME | SHIFT | NEWSHIFT | S/N | NAME | SHIFT | NEWSHIFT | S/N |
| 0 | 04290010 | 0.442899 | 0.00000 | 174.915 | 04290011 | -0.0130279 | 0.455927 | 184.416 |
| 1 | 04290013 | 0.436555 | 0.00634399 | 200.758 | 04290015 | -0.0141863 | 0.457085 | 200.994 |
| 2 | 04290014 | 0.434559 | 0.00834000 | 200.230 | 04290012 | -0.0122238 | 0.455123 | 195.241 |
| 3 | 04290009 | 0.430264 | 0.0126350 | 159.382 | 04290008 | 0.00000 | 0.442899 | 138.327 |