| Red | Green | Blue | |
| z | 17.64 | ||
| znorm | Inf | ||
| sky | -NaN | -NaN | -Inf |
| S/N | 32.1 | 53.6 | 56.7 |
| S/N(c) | 0.0 | 0.0 | 0.0 |
| SN(E/C) |

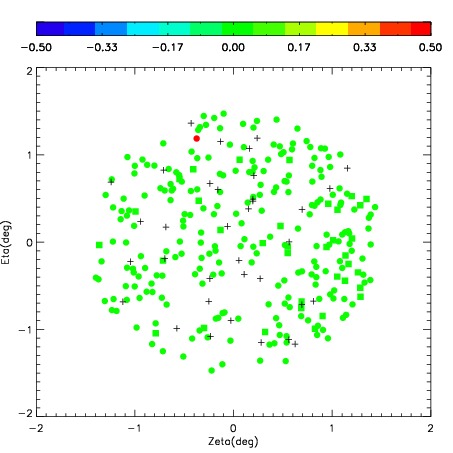
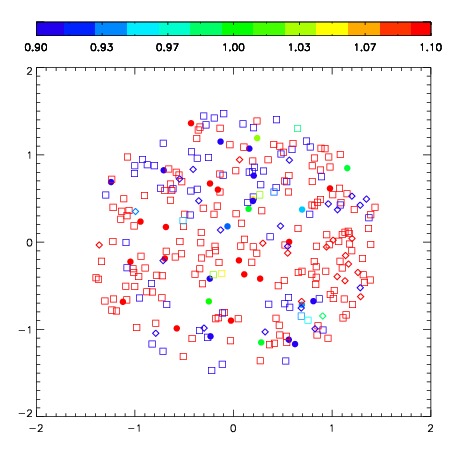
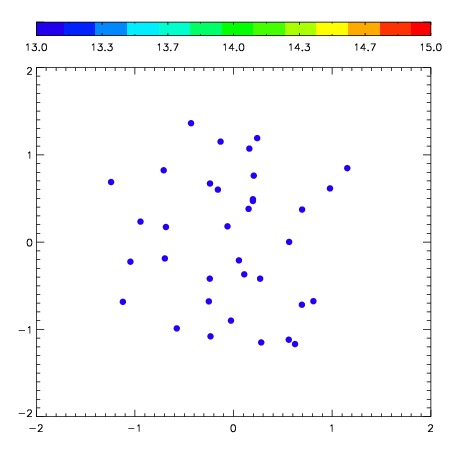
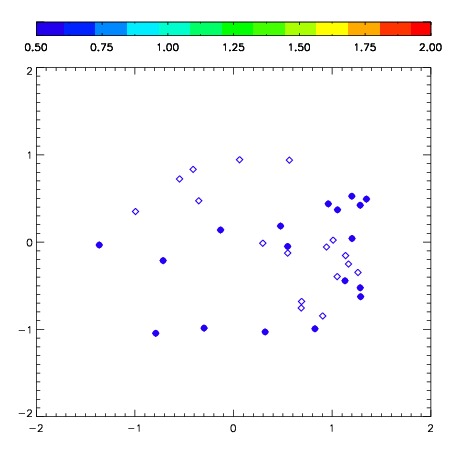
| Frame | Nreads | Zeropoints | Mag plots | Spatial mag deviation | Spatial sky 16325A emission deviations (filled: sky, open: star) | Spatial sky continuum emission | Spatial sky telluric CO2 absorption deviations (filled: H < 10) | |||||||||||||||||||||||
| 0 | 0 |
|
|
|
|
|
|
| IPAIR | NAME | SHIFT | NEWSHIFT | S/N | NAME | SHIFT | NEWSHIFT | S/N |
| 0 | 06280018 | 0.438355 | 0.00000 | 253.807 | 06280019 | 0.00683148 | 0.431524 | 258.180 |
| 1 | 06280017 | 0.436046 | 0.00230899 | 253.039 | 06280016 | -0.00378364 | 0.442139 | 249.523 |
| 2 | 06280013 | 0.436849 | 0.00150600 | 247.033 | 06280012 | 0.00000 | 0.438355 | 245.501 |
| 3 | 06280014 | 0.435645 | 0.00270998 | 246.330 | 06280015 | 0.000798941 | 0.437556 | 245.353 |