| Red | Green | Blue | |
| z | 17.64 | ||
| znorm | Inf | ||
| sky | -NaN | -NaN | -Inf |
| S/N | 17.4 | 31.4 | 35.8 |
| S/N(c) | 0.0 | 0.0 | 0.0 |
| SN(E/C) |

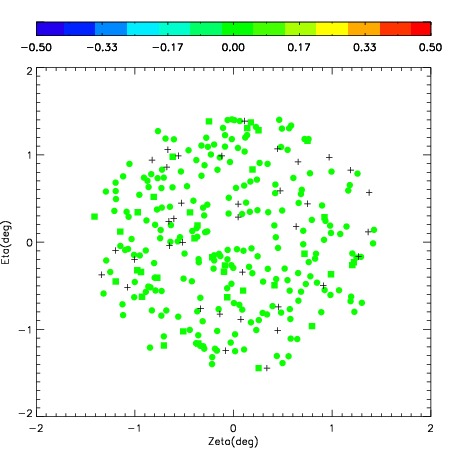

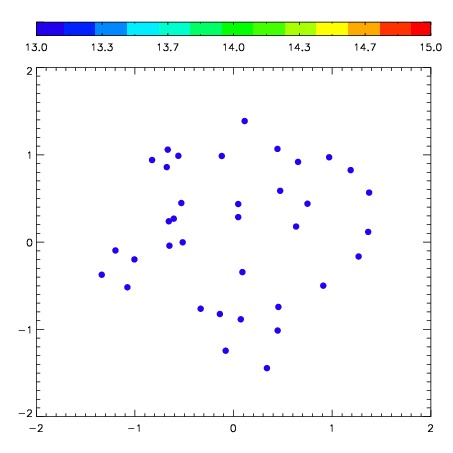
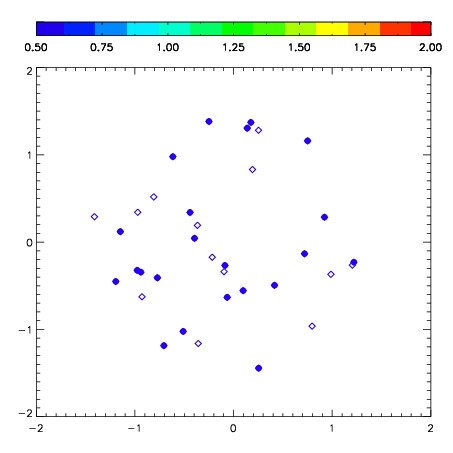
| Frame | Nreads | Zeropoints | Mag plots | Spatial mag deviation | Spatial sky 16325A emission deviations (filled: sky, open: star) | Spatial sky continuum emission | Spatial sky telluric CO2 absorption deviations (filled: H < 10) | |||||||||||||||||||||||
| 0 | 0 |
|
|
|
|
|
|
| IPAIR | NAME | SHIFT | NEWSHIFT | S/N | NAME | SHIFT | NEWSHIFT | S/N |
| 0 | 03650049 | 0.471799 | 0.00000 | 178.835 | 03650050 | 0.00966606 | 0.462133 | 168.489 |
| 1 | 03650052 | 0.456034 | 0.0157650 | 232.327 | 03650047 | 0.00000 | 0.471799 | 194.130 |
| 2 | 03650053 | 0.464439 | 0.00735998 | 215.723 | 03650054 | 0.00839725 | 0.463402 | 176.317 |
| 3 | 03650048 | 0.469471 | 0.00232798 | 187.725 | 03650051 | 0.00860992 | 0.463189 | 173.120 |