| Red | Green | Blue | |
| z | 17.64 | ||
| znorm | Inf | ||
| sky | -NaN | -NaN | -Inf |
| S/N | 27.7 | 45.2 | 49.6 |
| S/N(c) | 0.0 | 0.0 | 0.0 |
| SN(E/C) |

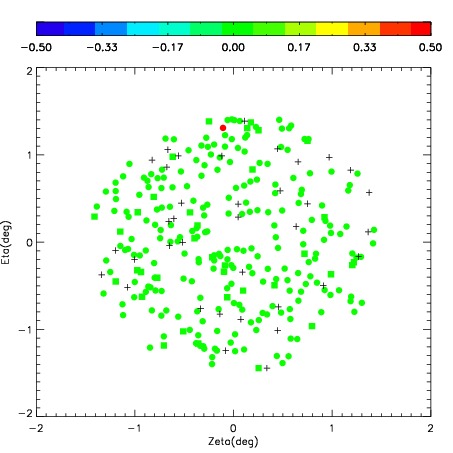
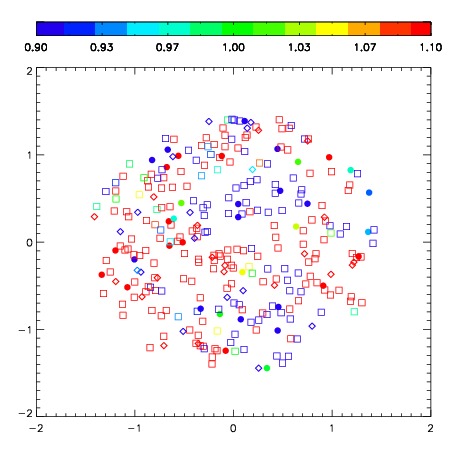


| Frame | Nreads | Zeropoints | Mag plots | Spatial mag deviation | Spatial sky 16325A emission deviations (filled: sky, open: star) | Spatial sky continuum emission | Spatial sky telluric CO2 absorption deviations (filled: H < 10) | |||||||||||||||||||||||
| 0 | 0 |
|
|
|
|
|
|
| IPAIR | NAME | SHIFT | NEWSHIFT | S/N | NAME | SHIFT | NEWSHIFT | S/N |
| 0 | 03710041 | 0.419035 | 0.00000 | 246.806 | 03710040 | 0.00000 | 0.419035 | 240.871 |
| 1 | 03710046 | 0.411830 | 0.00720498 | 253.552 | 03710047 | 0.00823066 | 0.410804 | 254.070 |
| 2 | 03710045 | 0.412749 | 0.00628600 | 252.351 | 03710044 | 0.00936106 | 0.409674 | 250.723 |
| 3 | 03710042 | 0.413961 | 0.00507399 | 251.957 | 03710043 | 0.00803009 | 0.411005 | 250.624 |