| Red | Green | Blue | |
| z | 17.64 | ||
| znorm | Inf | ||
| sky | -NaN | -Inf | -Inf |
| S/N | 25.9 | 42.6 | 48.7 |
| S/N(c) | 0.0 | 0.0 | 0.0 |
| SN(E/C) |

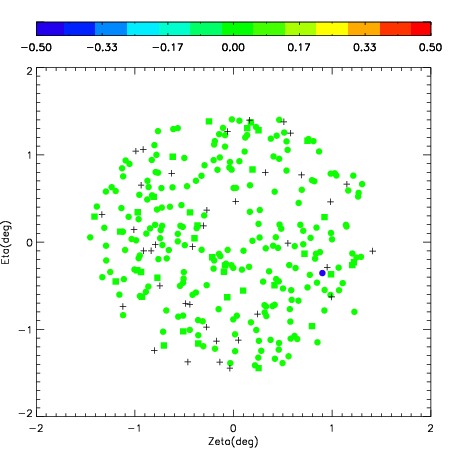
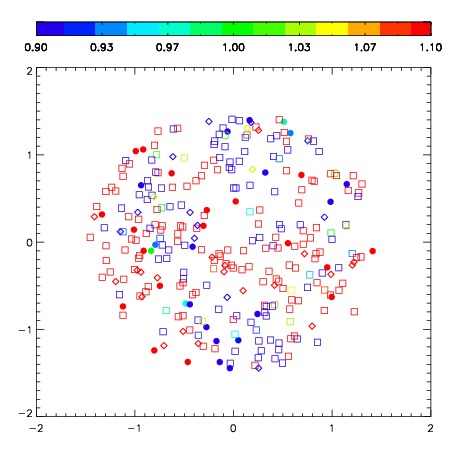


| Frame | Nreads | Zeropoints | Mag plots | Spatial mag deviation | Spatial sky 16325A emission deviations (filled: sky, open: star) | Spatial sky continuum emission | Spatial sky telluric CO2 absorption deviations (filled: H < 10) | |||||||||||||||||||||||
| 0 | 0 |
|
|
|
|
|
|
| IPAIR | NAME | SHIFT | NEWSHIFT | S/N | NAME | SHIFT | NEWSHIFT | S/N |
| 0 | 02860092 | 0.321813 | 0.00000 | 280.445 | 02860089 | -0.0135645 | 0.335377 | 285.372 |
| 1 | 02860087 | 0.315582 | 0.00623098 | 247.085 | 02860086 | 0.00000 | 0.321813 | 284.886 |
| 2 | 02860091 | 0.318295 | 0.00351799 | 243.394 | 02860090 | -0.0186381 | 0.340451 | 284.060 |
| 3 | 02860088 | 0.319575 | 0.00223798 | 0.00000 | 02860093 | -0.0153853 | 0.337198 | 252.592 |