| Red | Green | Blue | |
| z | 17.64 | ||
| znorm | Inf | ||
| sky | -NaN | -NaN | -Inf |
| S/N | 30.2 | 53.3 | 56.7 |
| S/N(c) | 0.0 | 0.0 | 0.0 |
| SN(E/C) |

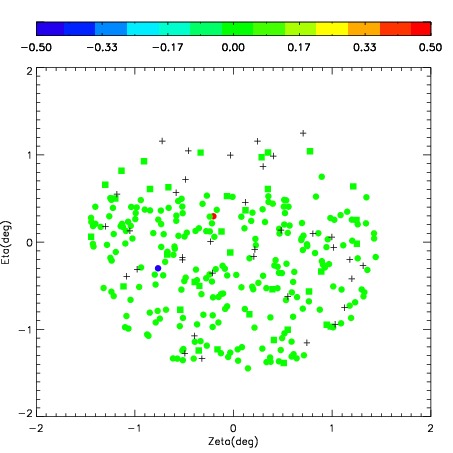

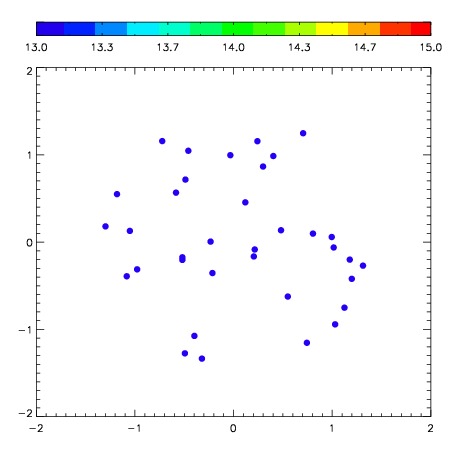
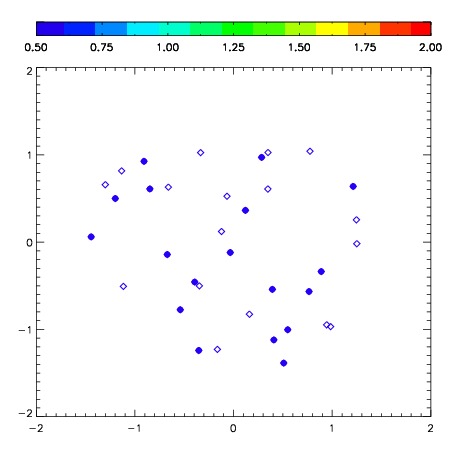
| Frame | Nreads | Zeropoints | Mag plots | Spatial mag deviation | Spatial sky 16325A emission deviations (filled: sky, open: star) | Spatial sky continuum emission | Spatial sky telluric CO2 absorption deviations (filled: H < 10) | |||||||||||||||||||||||
| 0 | 0 |
|
|
|
|
|
|
| IPAIR | NAME | SHIFT | NEWSHIFT | S/N | NAME | SHIFT | NEWSHIFT | S/N |
| 0 | 03130011 | 0.365318 | 0.00000 | 221.832 | 03130014 | -0.0637994 | 0.429117 | 211.821 |
| 1 | 03130020 | 0.351798 | 0.0135200 | 235.904 | 03130021 | -0.0673473 | 0.432665 | 236.109 |
| 2 | 03130015 | 0.361276 | 0.00404200 | 232.058 | 03130018 | -0.0604875 | 0.425806 | 228.411 |
| 3 | 03130016 | 0.358386 | 0.00693199 | 229.621 | 03130017 | -0.0651836 | 0.430502 | 226.125 |
| 4 | 03130019 | 0.361848 | 0.00347000 | 225.967 | 03130010 | 0.00000 | 0.365318 | 218.257 |
| 5 | 03130012 | 0.358649 | 0.00666901 | 217.588 | 03130013 | -0.0650298 | 0.430348 | 204.860 |