| Red | Green | Blue | |
| z | 17.64 | ||
| znorm | Inf | ||
| sky | -Inf | -Inf | -Inf |
| S/N | 29.7 | 51.4 | 61.6 |
| S/N(c) | 0.0 | 0.0 | 0.0 |
| SN(E/C) |


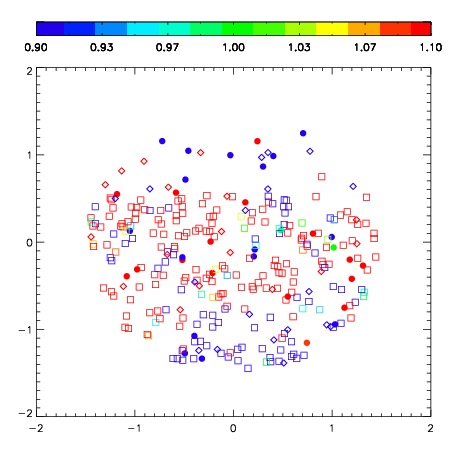
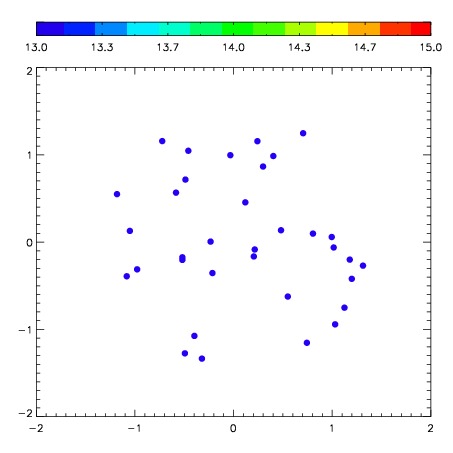
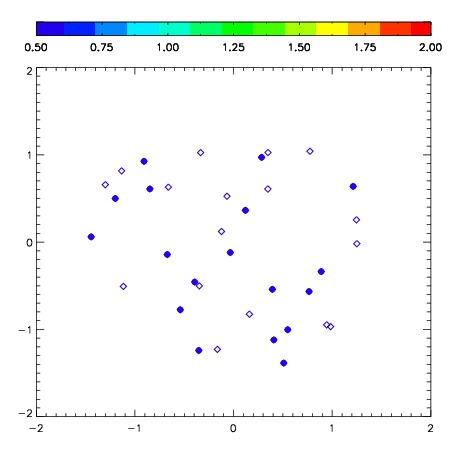
| Frame | Nreads | Zeropoints | Mag plots | Spatial mag deviation | Spatial sky 16325A emission deviations (filled: sky, open: star) | Spatial sky continuum emission | Spatial sky telluric CO2 absorption deviations (filled: H < 10) | |||||||||||||||||||||||
| 0 | 0 |
|
|
|
|
|
|
| IPAIR | NAME | SHIFT | NEWSHIFT | S/N | NAME | SHIFT | NEWSHIFT | S/N |
| 0 | 03680046 | 0.396779 | 0.00000 | 149.432 | 03680045 | 0.00000 | 0.396779 | 164.872 |
| 1 | 03680055 | 0.379808 | 0.0169710 | 268.058 | 03680056 | -0.0476026 | 0.444382 | 265.077 |
| 2 | 03680054 | 0.374688 | 0.0220910 | 264.137 | 03680053 | -0.0480962 | 0.444875 | 257.091 |
| 3 | 03680051 | 0.380320 | 0.0164590 | 246.520 | 03680052 | -0.0446518 | 0.441431 | 251.272 |
| 4 | 03680050 | 0.380324 | 0.0164550 | 240.877 | 03680049 | -0.0477415 | 0.444521 | 208.367 |
| 5 | 03680047 | 0.382109 | 0.0146700 | 211.396 | 03680048 | -0.0475987 | 0.444378 | 195.830 |