| Red | Green | Blue | |
| z | 17.64 | ||
| znorm | Inf | ||
| sky | -Inf | -Inf | -Inf |
| S/N | 11.0 | 20.0 | 22.1 |
| S/N(c) | 0.0 | 0.0 | 0.0 |
| SN(E/C) |

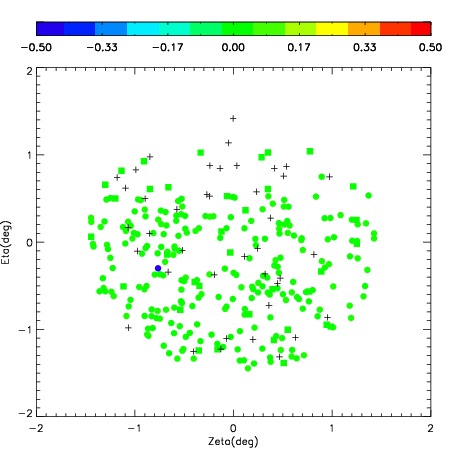
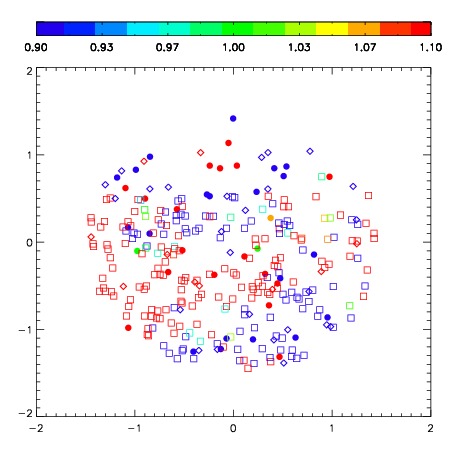


| Frame | Nreads | Zeropoints | Mag plots | Spatial mag deviation | Spatial sky 16325A emission deviations (filled: sky, open: star) | Spatial sky continuum emission | Spatial sky telluric CO2 absorption deviations (filled: H < 10) | |||||||||||||||||||||||
| 0 | 0 |
|
|
|
|
|
|
| IPAIR | NAME | SHIFT | NEWSHIFT | S/N | NAME | SHIFT | NEWSHIFT | S/N |
| 0 | 03140074 | 0.427415 | 0.00000 | 129.169 | 03140073 | 0.00000 | 0.427415 | 122.412 |
| 1 | 03140078 | 0.400563 | 0.0268520 | 216.465 | 03140077 | -0.0531705 | 0.480586 | 231.135 |
| 2 | 03140079 | 0.414622 | 0.0127930 | 182.070 | 03140076 | -0.0561837 | 0.483599 | 228.402 |
| 3 | 03140075 | 0.412205 | 0.0152100 | 166.211 | 03140080 | -0.0567476 | 0.484163 | 184.074 |