| Red | Green | Blue | |
| z | 17.64 | ||
| znorm | Inf | ||
| sky | -Inf | -Inf | -Inf |
| S/N | 22.7 | 40.1 | 43.4 |
| S/N(c) | 0.0 | 0.0 | 0.0 |
| SN(E/C) |
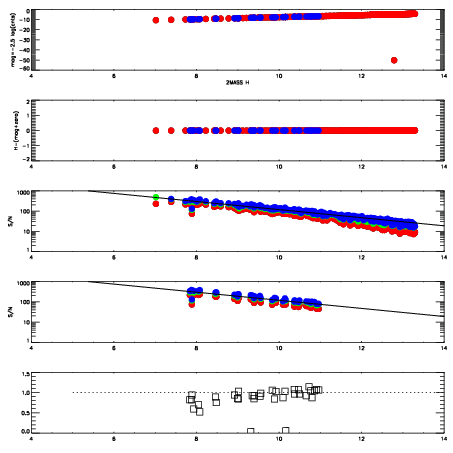
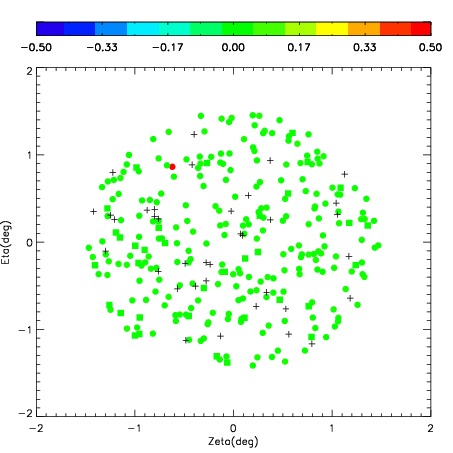
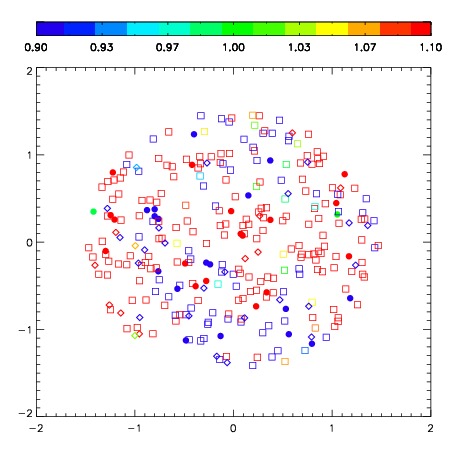
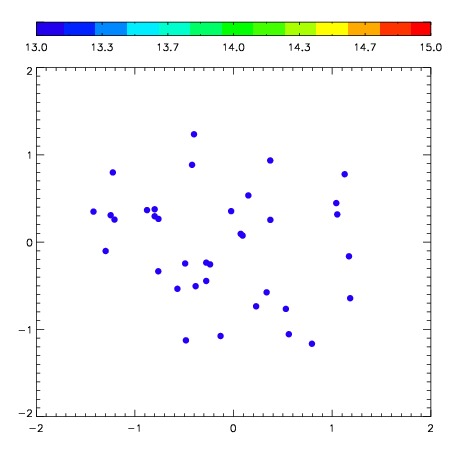
| Frame | Nreads | Zeropoints | Mag plots | Spatial mag deviation | Spatial sky 16325A emission deviations (filled: sky, open: star) | Spatial sky continuum emission | Spatial sky telluric CO2 absorption deviations (filled: H < 10) | |||||||||||||||||||||||
| 0 | 0 |
|
|
|
|
|
|
| IPAIR | NAME | SHIFT | NEWSHIFT | S/N | NAME | SHIFT | NEWSHIFT | S/N |
| 0 | 02860107 | 0.374521 | 0.00000 | 273.011 | 02860105 | 0.0112243 | 0.363297 | 275.989 |
| 1 | 02860103 | 0.356751 | 0.0177700 | 280.687 | 02860104 | 0.0112464 | 0.363275 | 280.003 |
| 2 | 02860102 | 0.365176 | 0.00934500 | 279.896 | 02860101 | 0.00000 | 0.374521 | 276.859 |
| 3 | 02860106 | 0.363281 | 0.0112400 | 270.917 | 02860108 | 0.0131512 | 0.361370 | 231.451 |