| Red | Green | Blue | |
| z | 17.64 | ||
| znorm | Inf | ||
| sky | -Inf | -Inf | -Inf |
| S/N | 25.3 | 44.1 | 47.2 |
| S/N(c) | 0.0 | 0.0 | 0.0 |
| SN(E/C) |

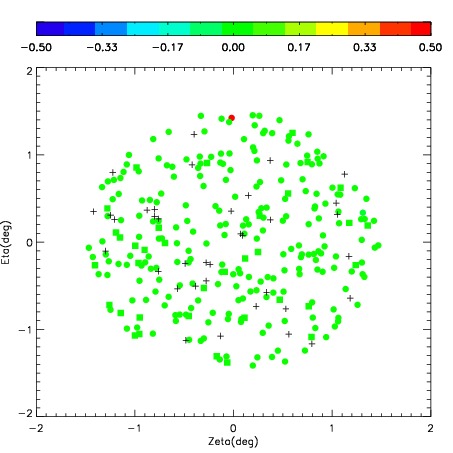
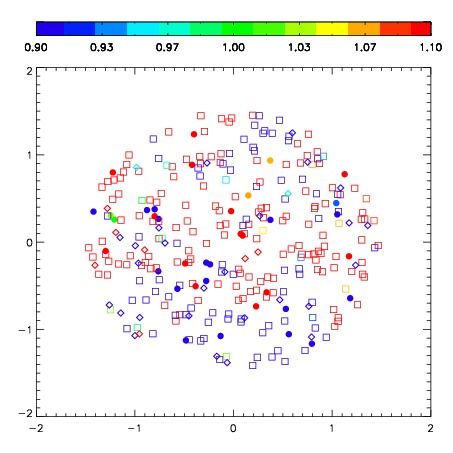


| Frame | Nreads | Zeropoints | Mag plots | Spatial mag deviation | Spatial sky 16325A emission deviations (filled: sky, open: star) | Spatial sky continuum emission | Spatial sky telluric CO2 absorption deviations (filled: H < 10) | |||||||||||||||||||||||
| 0 | 0 |
|
|
|
|
|
|
| IPAIR | NAME | SHIFT | NEWSHIFT | S/N | NAME | SHIFT | NEWSHIFT | S/N |
| 0 | 03120079 | 0.474777 | 0.00000 | 251.866 | 03120076 | 0.0288644 | 0.445913 | 276.093 |
| 1 | 03120074 | 0.460047 | 0.0147300 | 278.896 | 03120080 | 0.0328453 | 0.441932 | 278.033 |
| 2 | 03120075 | 0.450325 | 0.0244520 | 275.702 | 03120073 | 0.00000 | 0.474777 | 276.866 |
| 3 | 03120078 | 0.467645 | 0.00713202 | 246.631 | 03120077 | 0.0298879 | 0.444889 | 253.526 |