| Red | Green | Blue | |
| z | 17.64 | ||
| znorm | Inf | ||
| sky | -NaN | -Inf | -Inf |
| S/N | 29.1 | 51.2 | 58.9 |
| S/N(c) | 0.0 | 0.0 | 0.0 |
| SN(E/C) |

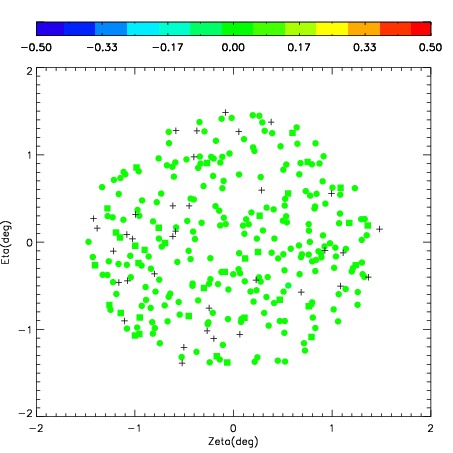
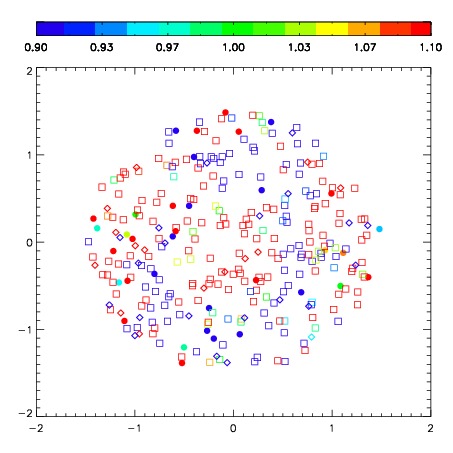
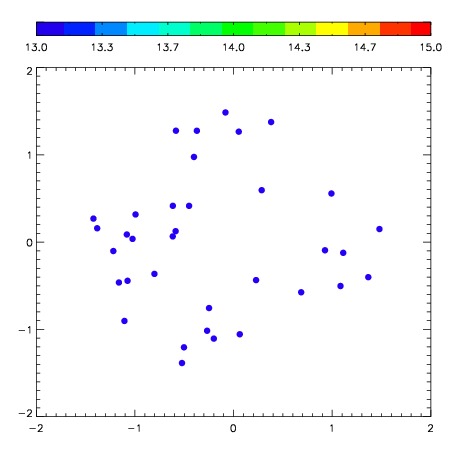

| Frame | Nreads | Zeropoints | Mag plots | Spatial mag deviation | Spatial sky 16325A emission deviations (filled: sky, open: star) | Spatial sky continuum emission | Spatial sky telluric CO2 absorption deviations (filled: H < 10) | |||||||||||||||||||||||
| 0 | 0 |
|
|
|
|
|
|
| IPAIR | NAME | SHIFT | NEWSHIFT | S/N | NAME | SHIFT | NEWSHIFT | S/N |
| 0 | 02810051 | 0.415979 | 0.00000 | 261.921 | 02810056 | 0.0164178 | 0.399561 | 256.209 |
| 1 | 02810062 | 0.412779 | 0.00319999 | 267.583 | 02810052 | 0.0191481 | 0.396831 | 260.870 |
| 2 | 02810059 | 0.411752 | 0.00422701 | 265.155 | 02810057 | 0.0181674 | 0.397812 | 258.422 |
| 3 | 02810058 | 0.409828 | 0.00615099 | 262.797 | 02810053 | 0.0165129 | 0.399466 | 256.933 |
| 4 | 02810050 | 0.409767 | 0.00621200 | 254.150 | 02810049 | 0.00000 | 0.415979 | 255.083 |
| 5 | 02810054 | 0.413313 | 0.00266600 | 252.957 | 02810061 | 0.0205986 | 0.395380 | 251.848 |
| 6 | 02810055 | 0.413800 | 0.00217900 | 228.324 | 02810064 | 0.0149915 | 0.400988 | 248.732 |