| Red | Green | Blue | |
| z | 17.64 | ||
| znorm | Inf | ||
| sky | -NaN | -NaN | -Inf |
| S/N | 25.9 | 43.6 | 52.5 |
| S/N(c) | 0.0 | 0.0 | 0.0 |
| SN(E/C) |
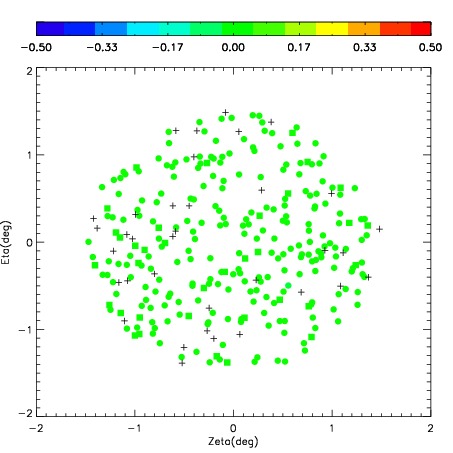
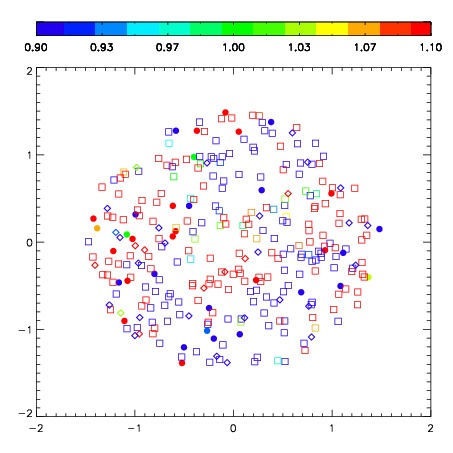


| Frame | Nreads | Zeropoints | Mag plots | Spatial mag deviation | Spatial sky 16325A emission deviations (filled: sky, open: star) | Spatial sky continuum emission | Spatial sky telluric CO2 absorption deviations (filled: H < 10) | |||||||||||||||||||||||
| 0 | 0 |
|
|
|
|
|
|
| IPAIR | NAME | SHIFT | NEWSHIFT | S/N | NAME | SHIFT | NEWSHIFT | S/N |
| 0 | 02820085 | 0.440502 | 0.00000 | 288.178 | 02820083 | 0.0440710 | 0.396431 | 283.796 |
| 1 | 02820084 | 0.437502 | 0.00299999 | 288.429 | 02820082 | 0.0428021 | 0.397700 | 288.377 |
| 2 | 02820081 | 0.434885 | 0.00561699 | 287.188 | 02820086 | 0.0452470 | 0.395255 | 277.407 |
| 3 | 02820080 | 0.439633 | 0.000868976 | 283.111 | 02820079 | 0.00000 | 0.440502 | 275.411 |