| Red | Green | Blue | |
| z | 17.64 | ||
| znorm | Inf | ||
| sky | -NaN | -NaN | -Inf |
| S/N | 22.4 | 38.5 | 41.1 |
| S/N(c) | 0.0 | 0.0 | 0.0 |
| SN(E/C) |
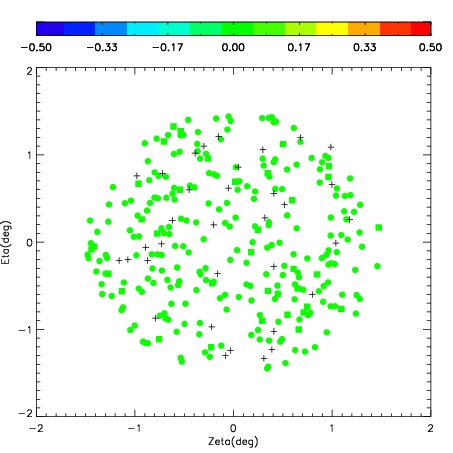
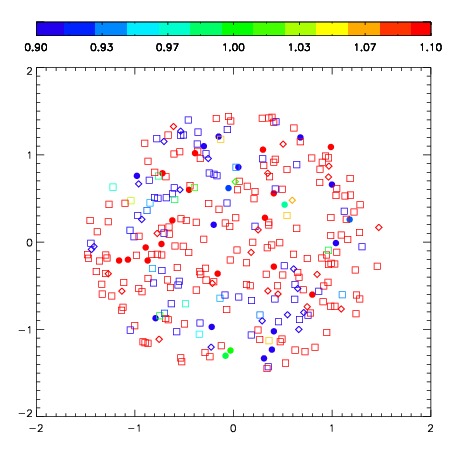
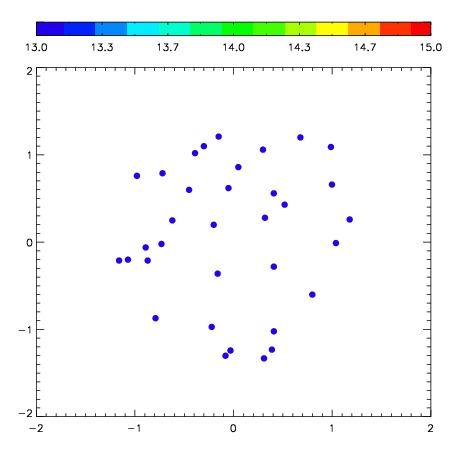

| Frame | Nreads | Zeropoints | Mag plots | Spatial mag deviation | Spatial sky 16325A emission deviations (filled: sky, open: star) | Spatial sky continuum emission | Spatial sky telluric CO2 absorption deviations (filled: H < 10) | |||||||||||||||||||||||
| 0 | 0 |
|
|
|
|
|
|
| IPAIR | NAME | SHIFT | NEWSHIFT | S/N | NAME | SHIFT | NEWSHIFT | S/N |
| 0 | 02900071 | 0.289617 | 0.00000 | 270.964 | 02900072 | -0.0487505 | 0.338367 | 272.952 |
| 1 | 02900070 | 0.280880 | 0.00873700 | 277.137 | 02900069 | 0.00000 | 0.289617 | 275.543 |
| 2 | 02900074 | 0.281518 | 0.00809899 | 265.524 | 02900076 | -0.0499892 | 0.339606 | 261.830 |
| 3 | 02900075 | 0.284819 | 0.00479800 | 259.916 | 02900073 | -0.0542259 | 0.343843 | 257.428 |