| Red | Green | Blue | |
| z | 17.64 | ||
| znorm | Inf | ||
| sky | -Inf | -NaN | -Inf |
| S/N | 20.7 | 36.9 | 43.9 |
| S/N(c) | 0.0 | 0.0 | 0.0 |
| SN(E/C) |

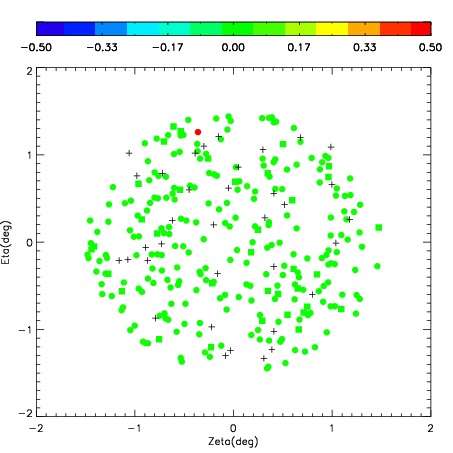
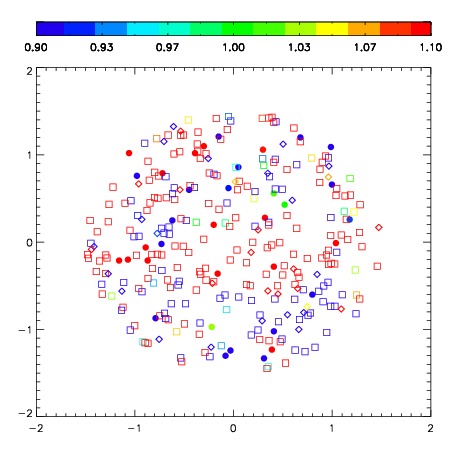
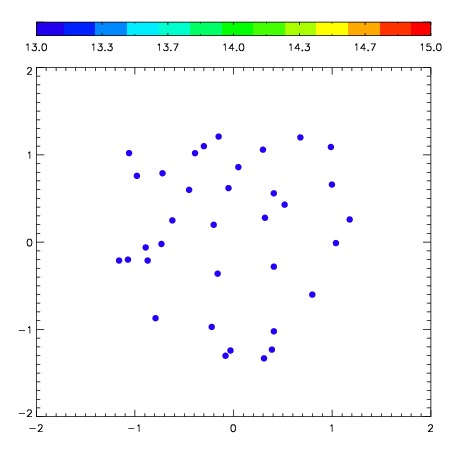

| Frame | Nreads | Zeropoints | Mag plots | Spatial mag deviation | Spatial sky 16325A emission deviations (filled: sky, open: star) | Spatial sky continuum emission | Spatial sky telluric CO2 absorption deviations (filled: H < 10) | |||||||||||||||||||||||
| 0 | 0 |
|
|
|
|
|
|
| IPAIR | NAME | SHIFT | NEWSHIFT | S/N | NAME | SHIFT | NEWSHIFT | S/N |
| 0 | 03210046 | 0.398378 | 0.00000 | 200.026 | 03210047 | -0.0555666 | 0.453945 | 188.284 |
| 1 | 03210042 | 0.385065 | 0.0133130 | 289.872 | 03210040 | 0.00000 | 0.398378 | 302.896 |
| 2 | 03210041 | 0.373128 | 0.0252500 | 250.793 | 03210043 | -0.0522362 | 0.450614 | 280.488 |
| 3 | 03210045 | 0.375048 | 0.0233300 | 240.869 | 03210044 | -0.0465076 | 0.444886 | 267.776 |