| Red | Green | Blue | |
| z | 17.64 | ||
| znorm | Inf | ||
| sky | -Inf | -Inf | -Inf |
| S/N | 21.9 | 36.7 | 40.2 |
| S/N(c) | 0.0 | 0.0 | 0.0 |
| SN(E/C) |
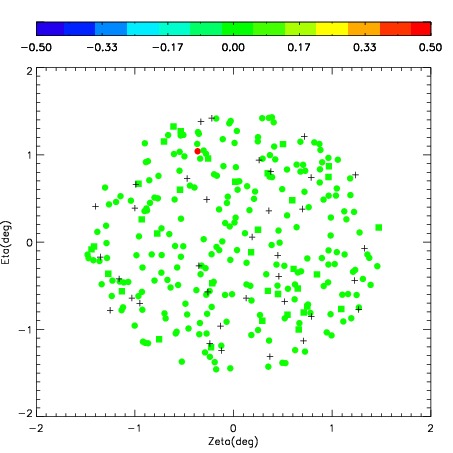
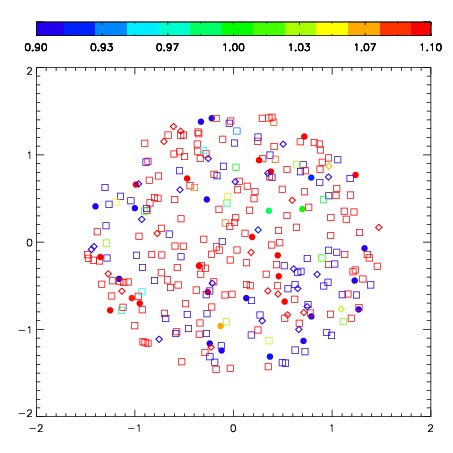

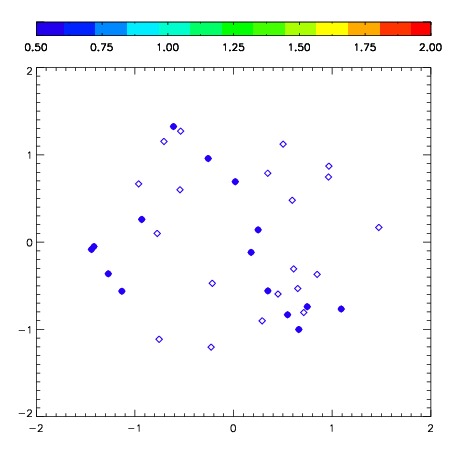
| Frame | Nreads | Zeropoints | Mag plots | Spatial mag deviation | Spatial sky 16325A emission deviations (filled: sky, open: star) | Spatial sky continuum emission | Spatial sky telluric CO2 absorption deviations (filled: H < 10) | |||||||||||||||||||||||
| 0 | 0 |
|
|
|
|
|
|
| IPAIR | NAME | SHIFT | NEWSHIFT | S/N | NAME | SHIFT | NEWSHIFT | S/N |
| 0 | 02890102 | 0.260078 | 0.00000 | 197.628 | 02890103 | -0.0496389 | 0.309717 | 199.242 |
| 1 | 02890101 | 0.255579 | 0.00449902 | 196.381 | 02890099 | -0.0502279 | 0.310306 | 192.514 |
| 2 | 02890097 | 0.257941 | 0.00213701 | 188.652 | 02890100 | -0.0526337 | 0.312712 | 191.609 |
| 3 | 02890098 | 0.257285 | 0.00279301 | 187.238 | 02890096 | 0.00000 | 0.260078 | 183.592 |