| Red | Green | Blue | |
| z | 17.64 | ||
| znorm | Inf | ||
| sky | -Inf | -Inf | -Inf |
| S/N | 22.6 | 42.0 | 45.9 |
| S/N(c) | 0.0 | 0.0 | 0.0 |
| SN(E/C) |


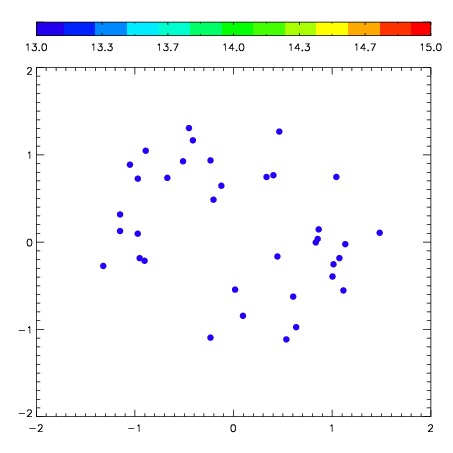
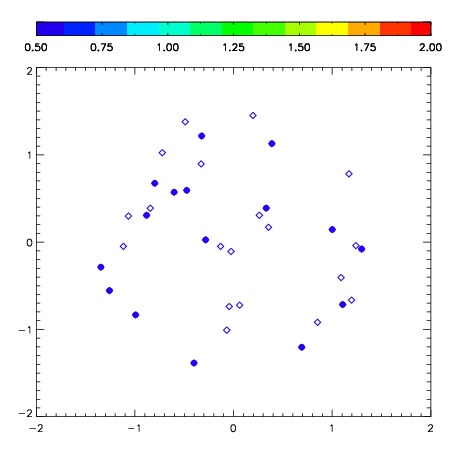
| Frame | Nreads | Zeropoints | Mag plots | Spatial mag deviation | Spatial sky 16325A emission deviations (filled: sky, open: star) | Spatial sky continuum emission | Spatial sky telluric CO2 absorption deviations (filled: H < 10) | |||||||||||||||||||||||
| 0 | 0 |
|
|
|
|
|
|
| IPAIR | NAME | SHIFT | NEWSHIFT | S/N | NAME | SHIFT | NEWSHIFT | S/N |
| 0 | 03430073 | 0.465284 | 0.00000 | 174.005 | 03430074 | 0.0228460 | 0.442438 | 184.353 |
| 1 | 03430069 | 0.443694 | 0.0215900 | 214.920 | 03430070 | 0.0218276 | 0.443456 | 206.388 |
| 2 | 03430068 | 0.451003 | 0.0142810 | 204.827 | 03430067 | 0.00000 | 0.465284 | 201.811 |
| 3 | 03430072 | 0.461682 | 0.00360200 | 187.746 | 03430071 | 0.0181322 | 0.447152 | 194.788 |