| Red | Green | Blue | |
| z | 17.64 | ||
| znorm | Inf | ||
| sky | -NaN | -NaN | -Inf |
| S/N | 22.0 | 37.0 | 39.4 |
| S/N(c) | 0.0 | 0.0 | 0.0 |
| SN(E/C) |

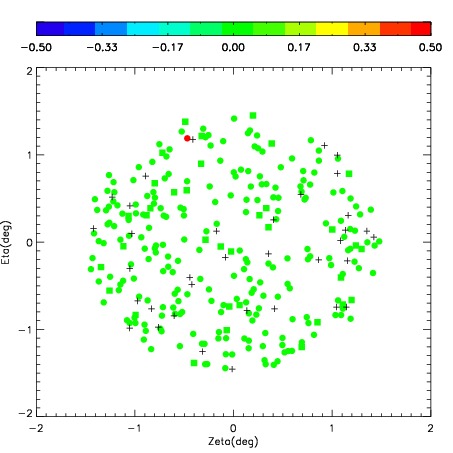
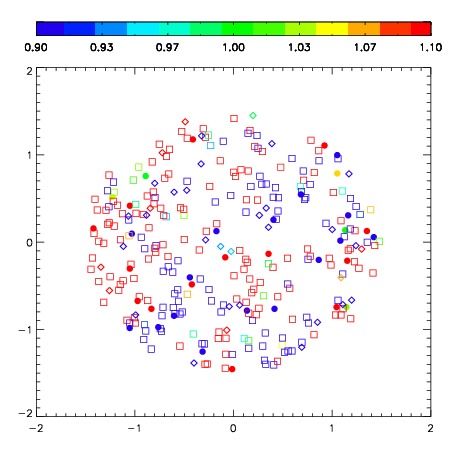


| Frame | Nreads | Zeropoints | Mag plots | Spatial mag deviation | Spatial sky 16325A emission deviations (filled: sky, open: star) | Spatial sky continuum emission | Spatial sky telluric CO2 absorption deviations (filled: H < 10) | |||||||||||||||||||||||
| 0 | 0 |
|
|
|
|
|
|
| IPAIR | NAME | SHIFT | NEWSHIFT | S/N | NAME | SHIFT | NEWSHIFT | S/N |
| 0 | 02820091 | 0.233429 | 0.00000 | 256.083 | 02820093 | -0.0576333 | 0.291062 | 249.846 |
| 1 | 02820095 | 0.224628 | 0.00880100 | 265.348 | 02820097 | -0.0630556 | 0.296485 | 272.775 |
| 2 | 02820096 | 0.228875 | 0.00455400 | 264.720 | 02820094 | -0.0618829 | 0.295312 | 259.745 |
| 3 | 02820092 | 0.229879 | 0.00354999 | 251.481 | 02820090 | 0.00000 | 0.233429 | 246.169 |