| Red | Green | Blue | |
| z | 17.64 | ||
| znorm | Inf | ||
| sky | -Inf | -Inf | -Inf |
| S/N | 25.0 | 42.2 | 45.7 |
| S/N(c) | 0.0 | 0.0 | 0.0 |
| SN(E/C) |

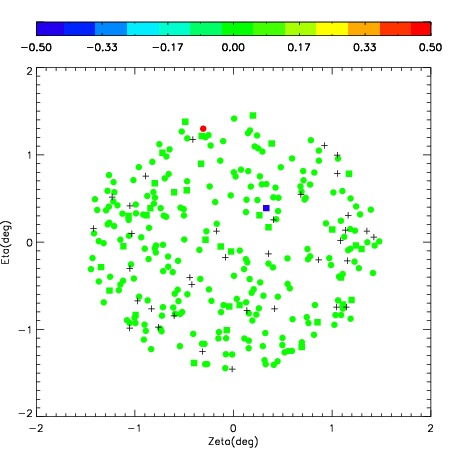
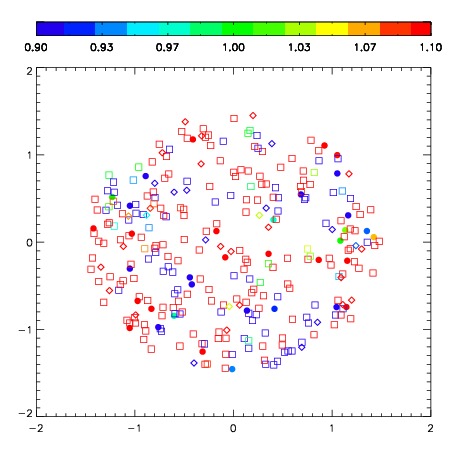
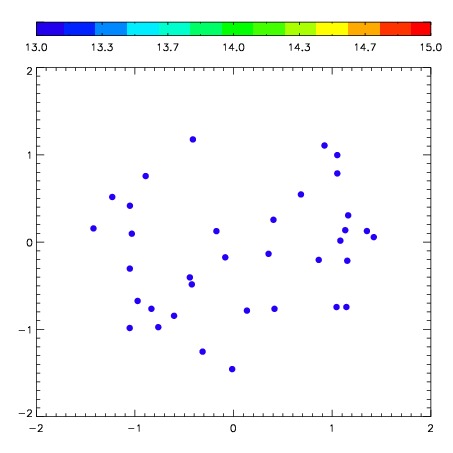

| Frame | Nreads | Zeropoints | Mag plots | Spatial mag deviation | Spatial sky 16325A emission deviations (filled: sky, open: star) | Spatial sky continuum emission | Spatial sky telluric CO2 absorption deviations (filled: H < 10) | |||||||||||||||||||||||
| 0 | 0 |
|
|
|
|
|
|
| IPAIR | NAME | SHIFT | NEWSHIFT | S/N | NAME | SHIFT | NEWSHIFT | S/N |
| 0 | 03440067 | 0.259474 | 0.00000 | 264.952 | 03440068 | -0.101434 | 0.360908 | 254.085 |
| 1 | 03440063 | 0.249904 | 0.00957000 | 275.748 | 03440061 | 0.00000 | 0.259474 | 270.733 |
| 2 | 03440062 | 0.256554 | 0.00292000 | 267.676 | 03440065 | -0.0893548 | 0.348829 | 269.673 |
| 3 | 03440066 | 0.259100 | 0.000374019 | 267.142 | 03440064 | -0.0850342 | 0.344508 | 267.563 |