| Red | Green | Blue | |
| z | 17.64 | ||
| znorm | Inf | ||
| sky | -NaN | -NaN | -Inf |
| S/N | 25.5 | 44.6 | 48.3 |
| S/N(c) | 0.0 | 0.0 | 0.0 |
| SN(E/C) |

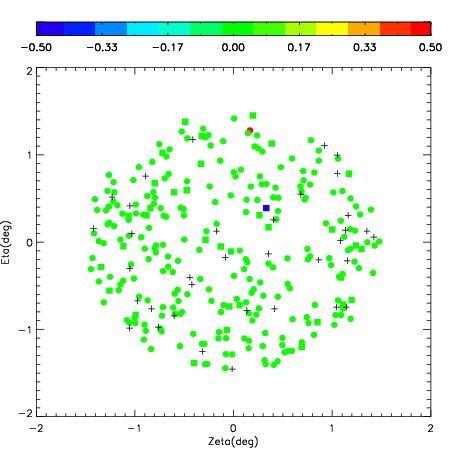
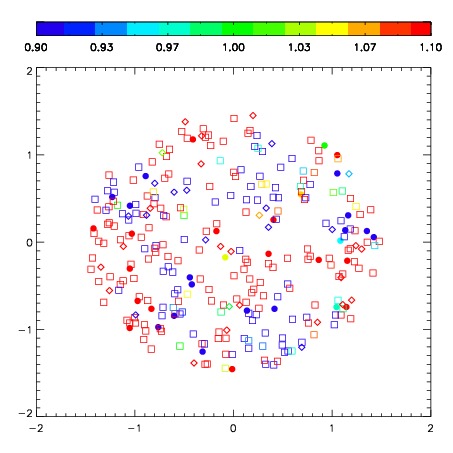


| Frame | Nreads | Zeropoints | Mag plots | Spatial mag deviation | Spatial sky 16325A emission deviations (filled: sky, open: star) | Spatial sky continuum emission | Spatial sky telluric CO2 absorption deviations (filled: H < 10) | |||||||||||||||||||||||
| 0 | 0 |
|
|
|
|
|
|
| IPAIR | NAME | SHIFT | NEWSHIFT | S/N | NAME | SHIFT | NEWSHIFT | S/N |
| 0 | 03690058 | 0.498198 | 0.00000 | 256.936 | 03690056 | 0.00000 | 0.498198 | 248.881 |
| 1 | 03690061 | 0.489167 | 0.00903100 | 238.390 | 03690059 | 0.0353744 | 0.462824 | 244.134 |
| 2 | 03690057 | 0.491998 | 0.00620002 | 235.395 | 03690060 | 0.0348357 | 0.463362 | 238.327 |
| 3 | 03690062 | 0.491186 | 0.00701201 | 234.088 | 03690063 | 0.0349538 | 0.463244 | 232.988 |