| Red | Green | Blue | |
| z | 17.64 | ||
| znorm | Inf | ||
| sky | -NaN | -NaN | -Inf |
| S/N | 28.0 | 48.8 | 52.4 |
| S/N(c) | 0.0 | 0.0 | 0.0 |
| SN(E/C) |

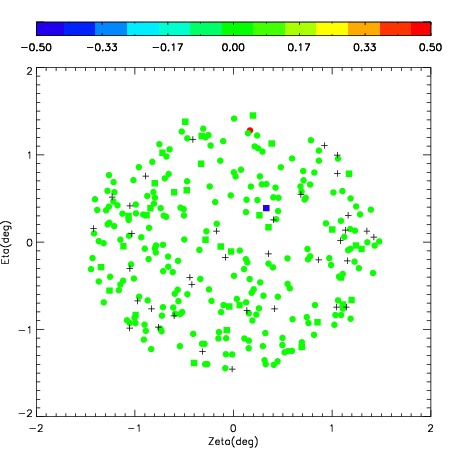
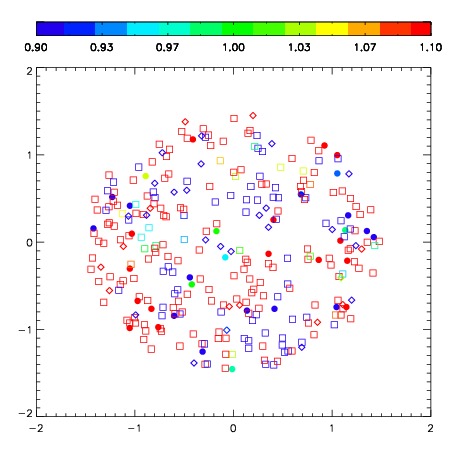

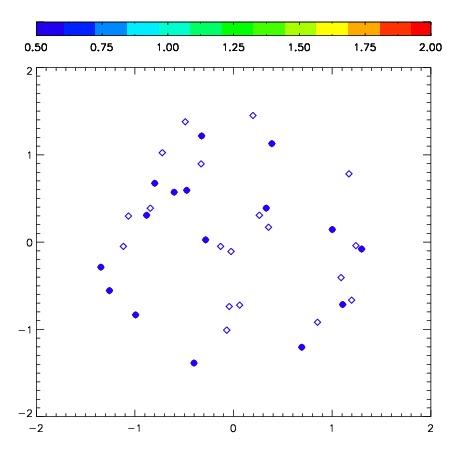
| Frame | Nreads | Zeropoints | Mag plots | Spatial mag deviation | Spatial sky 16325A emission deviations (filled: sky, open: star) | Spatial sky continuum emission | Spatial sky telluric CO2 absorption deviations (filled: H < 10) | |||||||||||||||||||||||
| 0 | 0 |
|
|
|
|
|
|
| IPAIR | NAME | SHIFT | NEWSHIFT | S/N | NAME | SHIFT | NEWSHIFT | S/N |
| 0 | 03700051 | 0.443652 | 0.00000 | 255.495 | 03700053 | 0.0182559 | 0.425396 | 255.435 |
| 1 | 03700055 | 0.442089 | 0.00156301 | 265.327 | 03700052 | 0.0182322 | 0.425420 | 269.113 |
| 2 | 03700054 | 0.435536 | 0.00811601 | 260.525 | 03700056 | 0.00817060 | 0.435481 | 255.703 |
| 3 | 03700050 | 0.443224 | 0.000427991 | 244.033 | 03700049 | 0.00000 | 0.443652 | 232.634 |