| Red | Green | Blue | |
| z | 17.64 | ||
| znorm | Inf | ||
| sky | -NaN | -NaN | -Inf |
| S/N | 28.1 | 48.7 | 54.0 |
| S/N(c) | 0.0 | 0.0 | 0.0 |
| SN(E/C) |

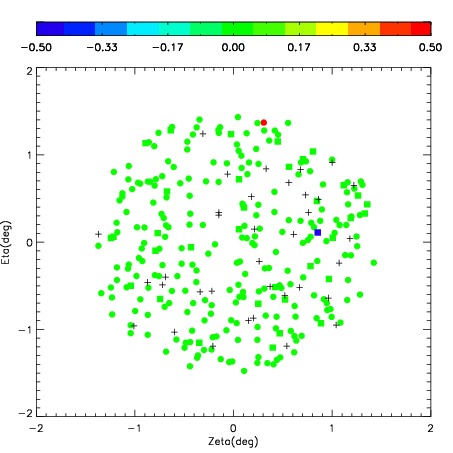
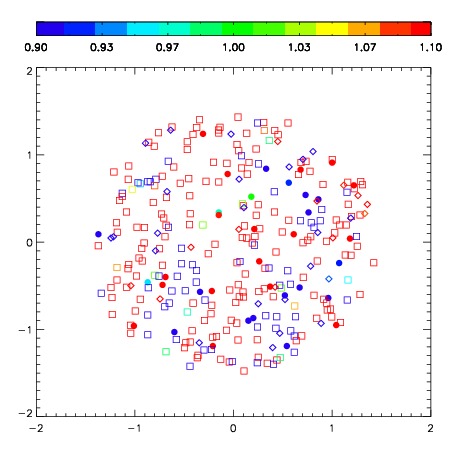


| Frame | Nreads | Zeropoints | Mag plots | Spatial mag deviation | Spatial sky 16325A emission deviations (filled: sky, open: star) | Spatial sky continuum emission | Spatial sky telluric CO2 absorption deviations (filled: H < 10) | |||||||||||||||||||||||
| 0 | 0 |
|
|
|
|
|
|
| IPAIR | NAME | SHIFT | NEWSHIFT | S/N | NAME | SHIFT | NEWSHIFT | S/N |
| 0 | 03720051 | 0.444176 | 0.00000 | 289.815 | 03720052 | 0.0231776 | 0.420998 | 290.240 |
| 1 | 03720054 | 0.440378 | 0.00379798 | 292.986 | 03720056 | 0.0215924 | 0.422584 | 293.343 |
| 2 | 03720055 | 0.436105 | 0.00807098 | 291.618 | 03720053 | 0.0224789 | 0.421697 | 292.359 |
| 3 | 03720050 | 0.440441 | 0.00373498 | 288.867 | 03720049 | 0.00000 | 0.444176 | 285.582 |