| Red | Green | Blue | |
| z | 17.64 | ||
| znorm | Inf | ||
| sky | -NaN | -NaN | -Inf |
| S/N | 31.5 | 54.8 | 60.5 |
| S/N(c) | 0.0 | 0.0 | 0.0 |
| SN(E/C) |

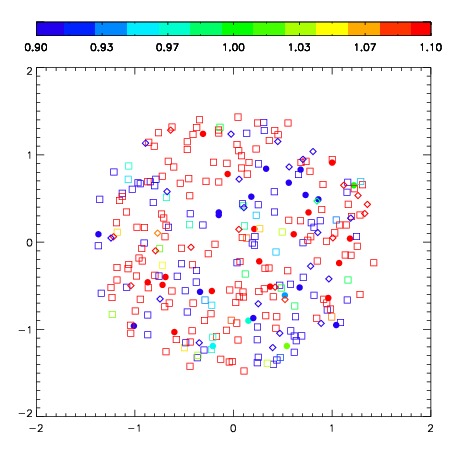
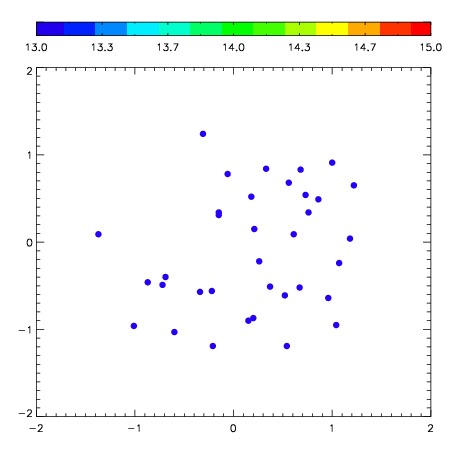
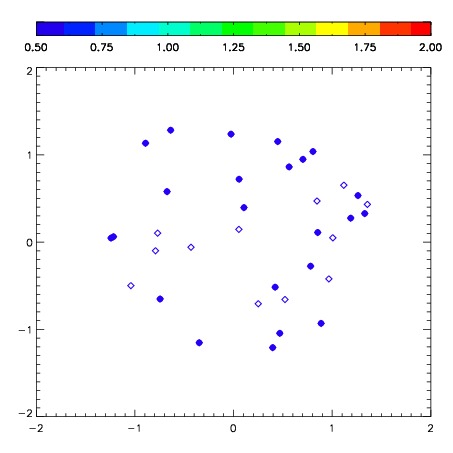
| Frame | Nreads | Zeropoints | Mag plots | Spatial mag deviation | Spatial sky 16325A emission deviations (filled: sky, open: star) | Spatial sky continuum emission | Spatial sky telluric CO2 absorption deviations (filled: H < 10) | |||||||||||||||||||||||
| 0 | 0 |
|
|
|
|
|
|
| IPAIR | NAME | SHIFT | NEWSHIFT | S/N | NAME | SHIFT | NEWSHIFT | S/N |
| 0 | 06690085 | 0.539391 | 0.00000 | 268.425 | 06690092 | 0.0846919 | 0.454699 | 266.990 |
| 1 | 06690090 | 0.534057 | 0.00533396 | 275.174 | 06690095 | 0.0790350 | 0.460356 | 278.443 |
| 2 | 06690094 | 0.534232 | 0.00515896 | 272.616 | 06690087 | 0.0834116 | 0.455979 | 277.810 |
| 3 | 06690086 | 0.536867 | 0.00252396 | 271.227 | 06690088 | 0.0813728 | 0.458018 | 273.141 |
| 4 | 06690089 | 0.531147 | 0.00824398 | 270.725 | 06690091 | 0.0798029 | 0.459588 | 269.938 |
| 5 | 06690093 | 0.537179 | 0.00221199 | 264.590 | 06690084 | 0.00000 | 0.539391 | 263.083 |