| Red | Green | Blue | |
| z | 17.64 | ||
| znorm | Inf | ||
| sky | -Inf | -Inf | -Inf |
| S/N | 24.1 | 40.3 | 43.2 |
| S/N(c) | 0.0 | 0.0 | 0.0 |
| SN(E/C) |

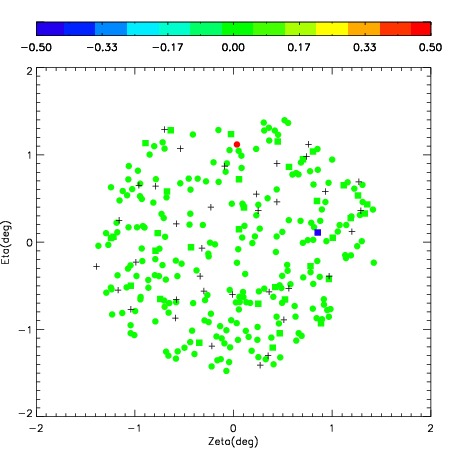
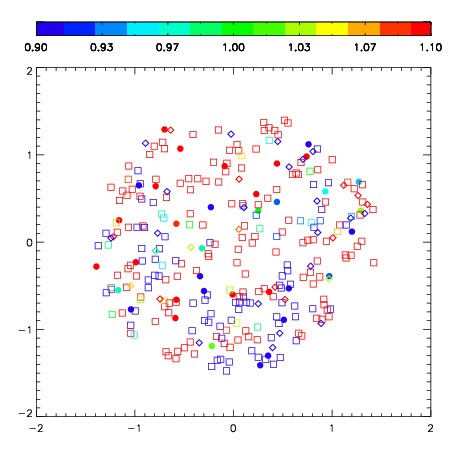

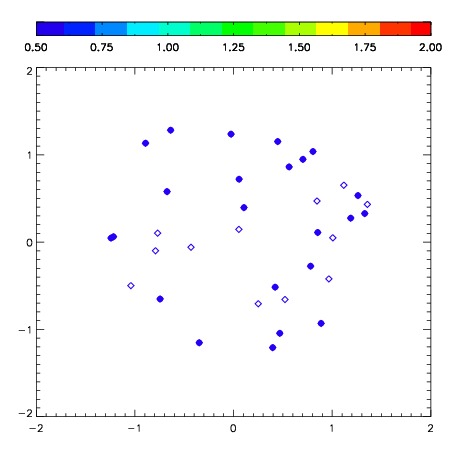
| Frame | Nreads | Zeropoints | Mag plots | Spatial mag deviation | Spatial sky 16325A emission deviations (filled: sky, open: star) | Spatial sky continuum emission | Spatial sky telluric CO2 absorption deviations (filled: H < 10) | |||||||||||||||||||||||
| 0 | 0 |
|
|
|
|
|
|
| IPAIR | NAME | SHIFT | NEWSHIFT | S/N | NAME | SHIFT | NEWSHIFT | S/N |
| 0 | 04280016 | 0.471422 | 0.00000 | 265.390 | 04280010 | 0.00000 | 0.471422 | 251.743 |
| 1 | 04280012 | 0.461679 | 0.00974298 | 281.907 | 04280022 | 0.0331006 | 0.438321 | 281.820 |
| 2 | 04280015 | 0.467210 | 0.00421199 | 269.265 | 04280013 | 0.0412847 | 0.430137 | 277.278 |
| 3 | 04280011 | 0.463736 | 0.00768599 | 269.037 | 04280014 | 0.0361709 | 0.435251 | 272.642 |