| Red | Green | Blue | |
| z | 17.64 | ||
| znorm | Inf | ||
| sky | -Inf | -Inf | -Inf |
| S/N | 21.7 | 36.1 | 42.1 |
| S/N(c) | 0.0 | 0.0 | 0.0 |
| SN(E/C) |


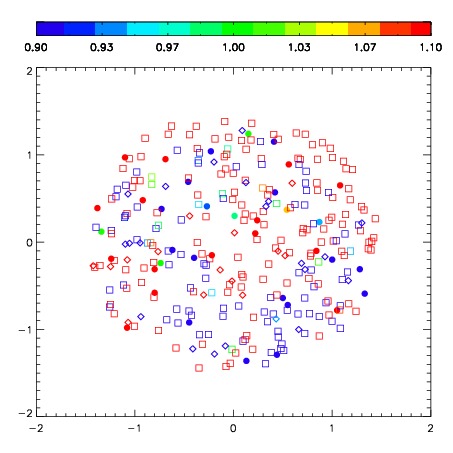

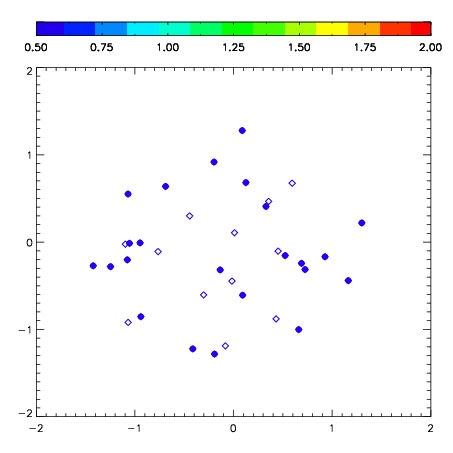
| Frame | Nreads | Zeropoints | Mag plots | Spatial mag deviation | Spatial sky 16325A emission deviations (filled: sky, open: star) | Spatial sky continuum emission | Spatial sky telluric CO2 absorption deviations (filled: H < 10) | |||||||||||||||||||||||
| 0 | 0 |
|
|
|
|
|
|
| IPAIR | NAME | SHIFT | NEWSHIFT | S/N | NAME | SHIFT | NEWSHIFT | S/N |
| 0 | 02920035 | 0.316921 | 0.00000 | 243.262 | 02920034 | 0.00000 | 0.316921 | 236.240 |
| 1 | 02920040 | 0.310801 | 0.00612000 | 252.624 | 02920041 | -0.00515491 | 0.322076 | 261.153 |
| 2 | 02920039 | 0.310002 | 0.00691900 | 251.633 | 02920038 | -0.0109379 | 0.327859 | 252.206 |
| 3 | 02920036 | 0.311344 | 0.00557700 | 249.456 | 02920037 | -0.00895064 | 0.325872 | 247.417 |