| Red | Green | Blue | |
| z | 17.64 | ||
| znorm | Inf | ||
| sky | -NaN | -Inf | -Inf |
| S/N | 22.5 | 39.4 | 45.0 |
| S/N(c) | 0.0 | 0.0 | 0.0 |
| SN(E/C) |


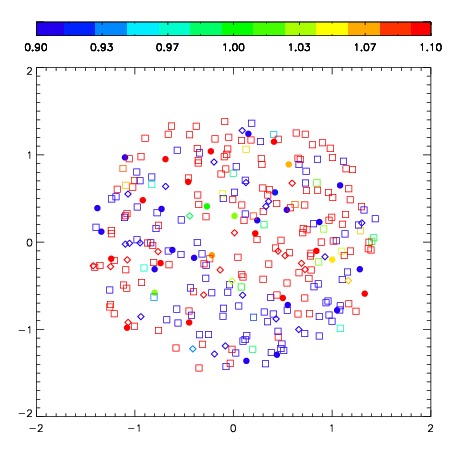
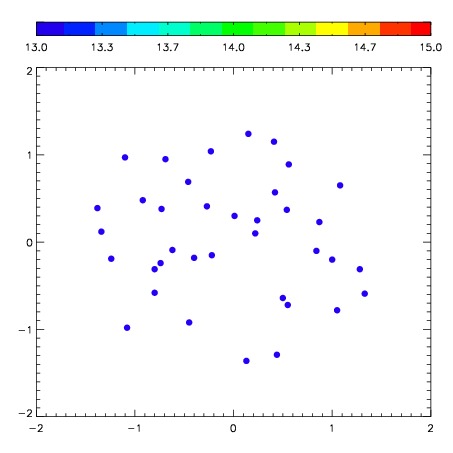

| Frame | Nreads | Zeropoints | Mag plots | Spatial mag deviation | Spatial sky 16325A emission deviations (filled: sky, open: star) | Spatial sky continuum emission | Spatial sky telluric CO2 absorption deviations (filled: H < 10) | |||||||||||||||||||||||
| 0 | 0 |
|
|
|
|
|
|
| IPAIR | NAME | SHIFT | NEWSHIFT | S/N | NAME | SHIFT | NEWSHIFT | S/N |
| 0 | 03480042 | 0.473412 | 0.00000 | 246.271 | 03480043 | 0.0189177 | 0.454494 | 247.918 |
| 1 | 03480037 | 0.468513 | 0.00489900 | 243.413 | 03480036 | 0.00000 | 0.473412 | 241.664 |
| 2 | 03480038 | 0.467437 | 0.00597501 | 232.771 | 03480039 | 0.0161777 | 0.457234 | 234.183 |
| 3 | 03480041 | 0.472244 | 0.00116801 | 213.007 | 03480040 | 0.0188557 | 0.454556 | 218.288 |