| Red | Green | Blue | |
| z | 17.64 | ||
| znorm | Inf | ||
| sky | -Inf | -Inf | -Inf |
| S/N | 29.4 | 49.4 | 53.8 |
| S/N(c) | 0.0 | 0.0 | 0.0 |
| SN(E/C) |
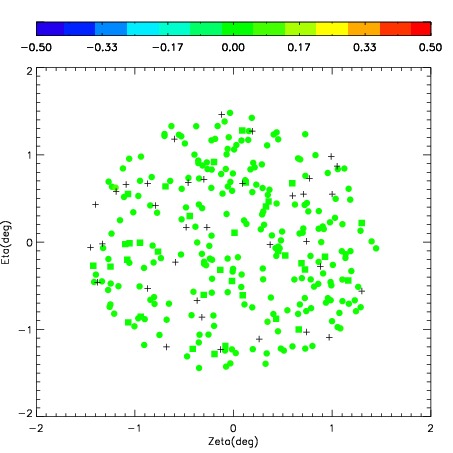
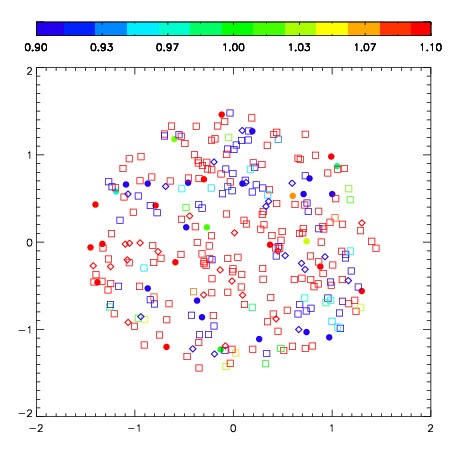
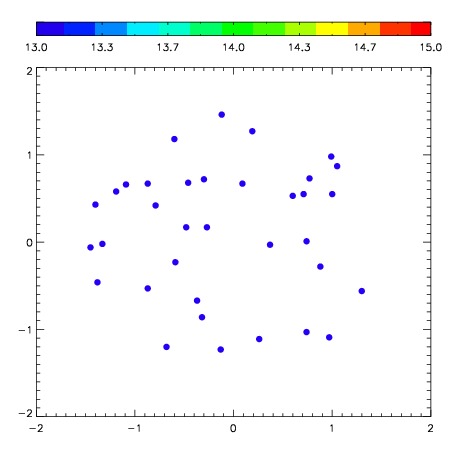
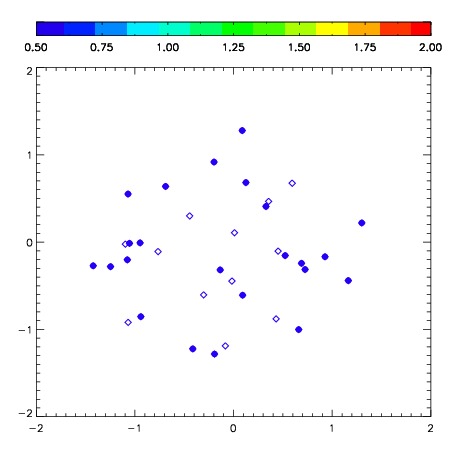
| Frame | Nreads | Zeropoints | Mag plots | Spatial mag deviation | Spatial sky 16325A emission deviations (filled: sky, open: star) | Spatial sky continuum emission | Spatial sky telluric CO2 absorption deviations (filled: H < 10) | |||||||||||||||||||||||
| 0 | 0 |
|
|
|
|
|
|
| IPAIR | NAME | SHIFT | NEWSHIFT | S/N | NAME | SHIFT | NEWSHIFT | S/N |
| 0 | 02910058 | 0.336775 | 0.00000 | 297.462 | 02910053 | -0.0151348 | 0.351910 | 294.991 |
| 1 | 02910055 | 0.332224 | 0.00455099 | 291.433 | 02910056 | -0.0118047 | 0.348580 | 294.104 |
| 2 | 02910054 | 0.331267 | 0.00550801 | 291.269 | 02910057 | -0.0122651 | 0.349040 | 293.839 |
| 3 | 02910051 | 0.327936 | 0.00883901 | 284.417 | 02910052 | -0.0131536 | 0.349929 | 290.408 |
| 4 | 02910050 | 0.327724 | 0.00905100 | 282.025 | 02910049 | 0.00000 | 0.336775 | 278.536 |