| Red | Green | Blue | |
| z | 17.64 | ||
| znorm | Inf | ||
| sky | -Inf | -Inf | -Inf |
| S/N | 29.4 | 49.4 | 54.1 |
| S/N(c) | 0.0 | 0.0 | 0.0 |
| SN(E/C) |

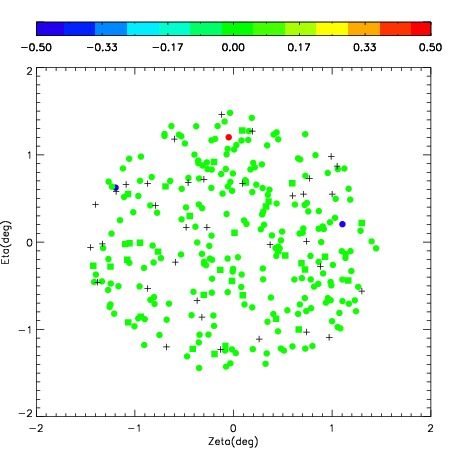
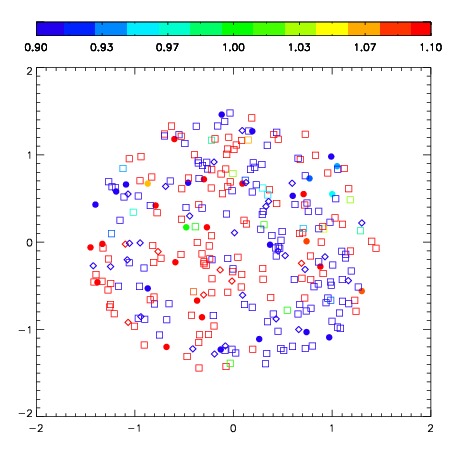


| Frame | Nreads | Zeropoints | Mag plots | Spatial mag deviation | Spatial sky 16325A emission deviations (filled: sky, open: star) | Spatial sky continuum emission | Spatial sky telluric CO2 absorption deviations (filled: H < 10) | |||||||||||||||||||||||
| 0 | 0 |
|
|
|
|
|
|
| IPAIR | NAME | SHIFT | NEWSHIFT | S/N | NAME | SHIFT | NEWSHIFT | S/N |
| 0 | 03670050 | 0.411945 | 0.00000 | 230.924 | 03670051 | 0.00635466 | 0.405590 | 240.083 |
| 1 | 03670054 | 0.392138 | 0.0198070 | 255.727 | 03670055 | -0.00139087 | 0.413336 | 256.087 |
| 2 | 03670053 | 0.399304 | 0.0126410 | 244.853 | 03670052 | 0.00175293 | 0.410192 | 247.360 |
| 3 | 03670049 | 0.408467 | 0.00347799 | 228.384 | 03670048 | 0.00000 | 0.411945 | 225.337 |