| Red | Green | Blue | |
| z | 17.63 | ||
| znorm | Inf | ||
| sky | -NaN | -NaN | -NaN |
| S/N | 22.2 | 34.5 | 36.4 |
| S/N(c) | 0.0 | 0.0 | 0.0 |
| SN(E/C) |

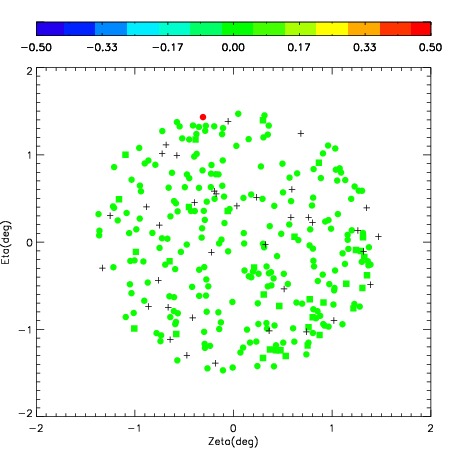
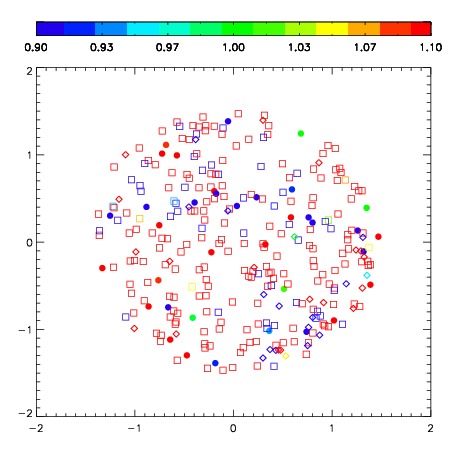


| Frame | Nreads | Zeropoints | Mag plots | Spatial mag deviation | Spatial sky 16325A emission deviations (filled: sky, open: star) | Spatial sky continuum emission | Spatial sky telluric CO2 absorption deviations (filled: H < 10) | |||||||||||||||||||||||
| 0 | 0 |
|
|
|
|
|
|
| IPAIR | NAME | SHIFT | NEWSHIFT | S/N | NAME | SHIFT | NEWSHIFT | S/N |
| 0 | 05490035 | 0.457391 | 0.00000 | 173.352 | 05490036 | 0.0264387 | 0.430952 | 173.575 |
| 1 | 05490039 | 0.451379 | 0.00601199 | 191.881 | 05490040 | 0.0255858 | 0.431805 | 199.852 |
| 2 | 05490038 | 0.448353 | 0.00903800 | 179.157 | 05490037 | 0.0199647 | 0.437426 | 181.060 |
| 3 | 05490034 | 0.447929 | 0.00946200 | 166.577 | 05490033 | 0.00000 | 0.457391 | 146.981 |